FlySafe was not operational during this event. This analysis reconstructs what publicly available signals looked like before the closures — to demonstrate the data our system now monitors.
Gulf Airspace Closures
February 28, 2026
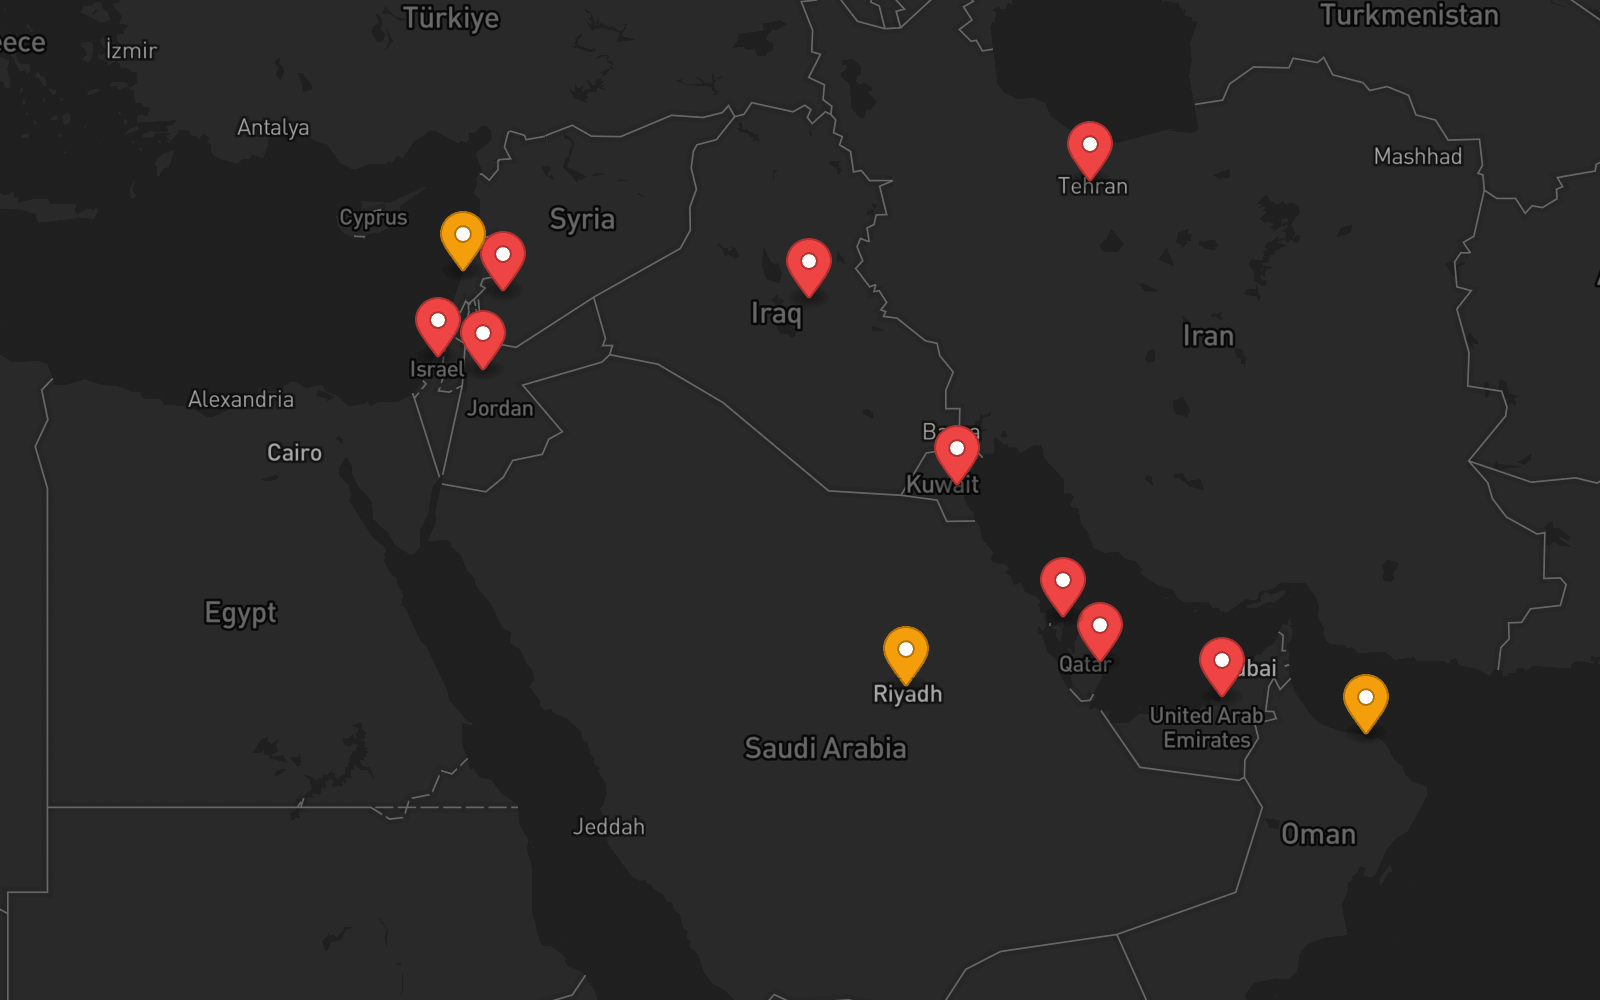
The largest simultaneous airspace closure in Middle East aviation history. Twelve Flight Information Regions affected across nine countries. Up to 144 hours of full closure for some airspaces.
Event
On February 28, 2026, a regional military escalation resulted in the simultaneous closure or restriction of 12 Flight Information Regions across the Middle East and Persian Gulf. This was the largest coordinated airspace disruption in the region's history.
| FIR | Country | Type | Duration |
|---|---|---|---|
| OIIX | Iran (Tehran) | Full closure | Ongoing |
| OISS | Iran (Isfahan) | Full closure | Ongoing |
| ORBB | Iraq | Full closure | Ongoing |
| LLLL | Israel | Full closure | Ongoing |
| OSTT | Syria | Full closure | Ongoing |
| OKAC | Kuwait | Full closure | Ongoing |
| OTBD | Qatar | Full closure | 144h |
| OBBB | Bahrain | Full closure | 144h |
| OMAE | UAE | Full closure | 48h |
| OJAC | Jordan | Full closure | 120h |
| OLBB | Lebanon | Restricted | Ongoing |
| OEDF | Saudi Arabia (Riyadh) | Restricted | Ongoing |
| OEJD | Saudi Arabia (Jeddah) | Restricted | Ongoing |
| OOMM | Oman | Restricted | Ongoing |
Source: NOTAM publications, EASA CZIB-143294. "Ongoing" indicates closure continued beyond the analysis period.
Early Signals
A retrospective review of publicly available data shows that multiple signal categories indicated escalation in the days preceding the closures:
CZIB-143294 issued February 27 — one day before closures. Covered all 12 FIRs. Elevated to Level 2 (highest).
Armed conflict databases recorded significant escalation over 7–14 days, with elevated fatality counts and cross-border event patterns.
Sharp shift in media tone across Middle East aviation and conflict keywords 48–72 hours before the event.
NASA FIRMS detected elevated night-time thermal signatures consistent with military activity patterns.
US State Department and UK FCDO elevated advisory levels for multiple countries in preceding weeks.
OpenSky Network data showed airlines rerouting away from Iranian and Iraqi airspace 24 hours before official NOTAMs.
Timeline
Travel advisories elevated for Iran, Iraq, and Lebanon. Conflict databases show rising event counts in the region.
News sentiment shifts significantly. Media monitoring detects escalation keywords across multiple feeds. Satellite thermal anomalies increase.
Airlines begin rerouting (visible in ADS-B data). EASA publishes CZIB-143294 on Feb 27, covering 12 FIRs at Level 2.
First closure NOTAMs published. Within hours, 9 FIRs fully closed, 5 more restricted. All commercial traffic rerouted or grounded.
UAE reopens after 48h. Jordan after 120h. Qatar and Bahrain partially reopen after 144h. Several FIRs remain closed.
What Airlines Actually Did
ADS-B data reveals that some operators began adjusting operations before official NOTAMs — while others did not. The difference in outcomes was significant.
- Rerouted flights 12–24h before NOTAMs
- Pre-positioned crews and aircraft outside affected FIRs
- Proactively rebooked passengers via alternative hubs
- Minimal cancellations, controlled cost increase
- Flights already airborne when closures hit
- Emergency diversions to airports at capacity
- Passengers stranded 3–5 days at Gulf hubs
- Mass cancellations, EU261/MC99 compensation triggered
Cost estimates based on industry averages for long-haul diversions. Actual figures vary by airline, route, and aircraft type.
Aviation Impact
Dubai (DXB), Doha (DOH), Abu Dhabi (AUH), and Bahrain (BAH) — four of the world's largest international hubs — simultaneously offline.
All Europe–Asia and Europe–Gulf routes disrupted. Airlines forced to southern (Africa–Indian Ocean) or northern (Central Asia) corridors.
Each diverted long-haul flight costs $80–200K in fuel, crew, and compensation. Thousands of flights affected over 6 days.
Hundreds of thousands stranded at Gulf hubs. Airlines with no advance warning had the worst delays.
Takeaway
Publicly available data — conflict event databases, news sentiment, EASA bulletins, satellite imagery, and ADS-B traffic patterns — showed measurable escalation signals days before the first NOTAM was published.
Airlines that acted on early indicators minimized disruption. Those that waited for official NOTAMs faced the full impact: canceled flights, stranded passengers, and hundreds of millions in losses.
Had a system like FlySafe been operational, these signals may have been aggregated automatically — scoring risk per FIR across 72-hour, 7-day, and 30-day horizons. The goal: give operators actionable warning before disruption becomes unavoidable.
Sources
- EASA — Conflict Zone Information Bulletin CZIB-143294, February 27, 2026
- ICAO — NOTAM publications for OIIX, OISS, ORBB, LLLL, OSTT, OKAC, OTBD, OBBB, OMAE, OJAC, OLBB, OEDF, OEJD, OOMM FIRs
- NASA FIRMS — Fire Information for Resource Management System, thermal anomaly data
- OpenSky Network — ADS-B flight tracking data, aircraft trajectory analysis
- ACLED — Armed Conflict Location & Event Data, Middle East region
- US State Department — Travel advisories for Iran, Iraq, Lebanon, Syria
- UK FCDO — Foreign travel advice updates, February 2026
All data sourced from publicly available records and open data platforms.
This is a retrospective analysis of publicly documented events. FlySafe's prediction system was not operational during this event. Signal categories described are based on data sources that were available at the time and are now part of FlySafe's monitoring pipeline. All information is sourced from public records, EASA publications, and open data.