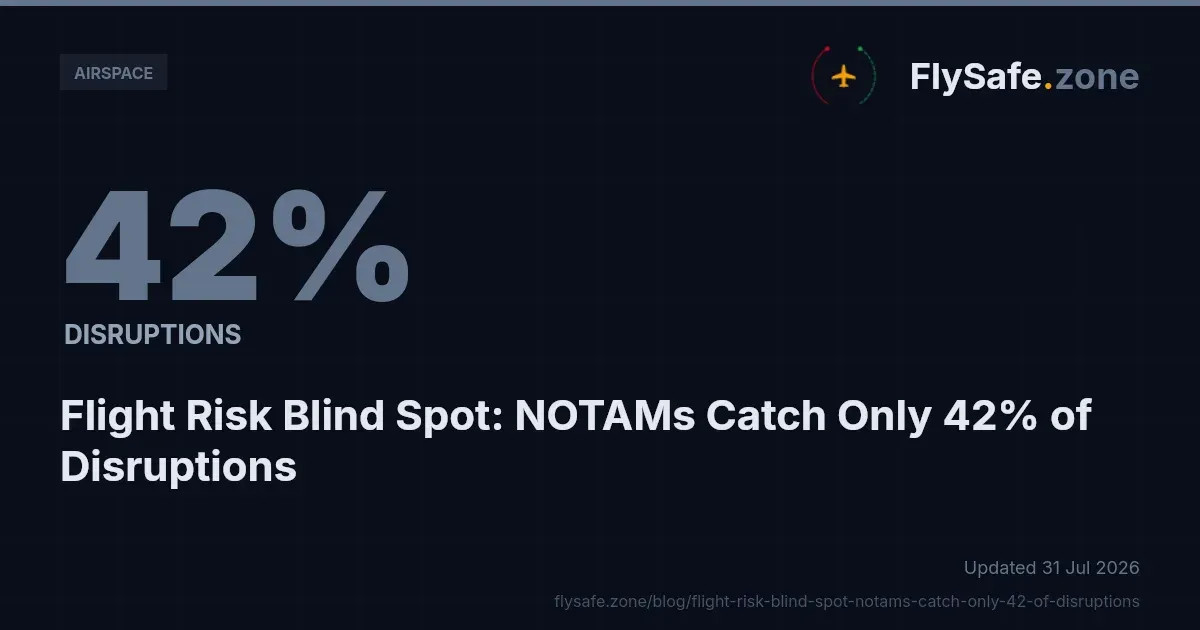
Across flight information regions that recorded three or more confirmed disruption events in 2026, formal NOTAMs corroborated approximately 42% of those events — while independent flight-traffic data corroborated approximately 78% (FlySafe airspace-risk collectors, data as of 2026-07-31). This is the flight risk meaning that matters to operations: not a label on a briefing package, but the measurable probability that a planned route crosses airspace whose operational status has changed without a matching formal notice. A review process built on NOTAMs alone, the data indicates, misses the majority of confirmed disruptions.
FlySafe's confirmed-event dataset for 2026 year to date — 457 confirmed airspace-disruption events across 66 FIRs, totalling 3,612 airspace-days between 2026-01-01 and 2026-07-31 — provides the basis for quantifying that gap. Every event in the dataset required at least two independent signals and an attributed cause; detections with undetermined causes were excluded.
The Corroboration Gap: 78% vs 42%
The central finding is a signal-source asymmetry. Among FIRs with at least three confirmed events, FlySafe's own ADS-B flight-traffic collection corroborated roughly 78% of events. Public NOTAMs corroborated roughly 42%. The two figures describe the same set of confirmed disruptions observed through two different instruments — and the instrument most operators check first performed materially worse.
The route-planning implication is direct. Dispatch workflows that treat the NOTAM system as a complete picture of airspace status will, on the 2026 evidence, fail to surface most confirmed disruptions in the affected regions. This does not mean NOTAMs are inaccurate where issued; it means issuance is incomplete relative to what aircraft behavior demonstrates on the ground — or rather, in the air. When traffic vacates or reroutes around a volume of airspace and no corresponding notice exists, the disruption is real but formally invisible. A fuller treatment of this pattern is available in FlySafe's companion analysis of why NOTAMs miss most airspace disruptions in 2026.
2026 Year to Date: 457 Events, 66 FIRs, 3,612 Airspace-Days
The full-period totals establish the scale. From 2026-01-01 through 2026-07-31, FlySafe collectors confirmed 457 airspace-disruption events across 66 FIRs, amounting to 3,612 airspace-days of disrupted operations.
The monthly confirmed-event trend shows a pronounced ramp through the period:
| Month (2026) | Confirmed events |
|---|---|
| January | 5 |
| February | 16 |
| March | 1 |
| April | 21 |
| May | 72 |
| June | 143 |
| July | 199 |
July alone accounted for 199 confirmed events — more than the first five months combined. The dataset records the trend; it does not attribute a single driver to it, and none is asserted here.
By neutral operational cause category, measured in airspace-days:
- Volcanic ash — 53% (1,916 airspace-days, 171 events)
- Conflict-zone restrictions — 33% (1,174 airspace-days, 177 events)
- Seismic activity — 8% (297 airspace-days, 42 events)
- Tropical cyclones — 4% (128 airspace-days, 21 events)
- Other regulatory restrictions — 3% (97 airspace-days, 46 events)
Percentages are rounded. Notably, conflict-zone restrictions produced slightly more events than volcanic ash (177 vs 171) but substantially fewer airspace-days — volcanic events, on this evidence, ran longer per event.
Most-Disrupted FIRs — and How Each Was Detected
The six most disrupted FIRs by airspace-days, with the corroboration profile of each:
| FIR | Events | Airspace-days | Flight-traffic corroboration | NOTAM corroboration |
|---|---|---|---|---|
| Damascus FIR (OSTT) | 51 | 511.0 | 37% | 61% |
| RPHI | 31 | 431.0 | 0% | 94% |
| Tehran FIR (OIIX) | 43 | 282.0 | 77% | 49% |
| WIIF | 20 | 269.0 | 100% | 100% |
| UHMM | 21 | 260.0 | 0% | 95% |
| SEFG | 15 | 225.0 | 0% | 100% |
A ranked breakdown of the full FIR table is maintained in 2026's most-disrupted FIRs.
The table reveals that the blind spot is not one-directional. Three distinct detection profiles appear:
NOTAM-strong, traffic-silent regions
RPHI, UHMM, and SEFG show 94–100% NOTAM corroboration but 0% flight-traffic corroboration. In these FIRs the formal notice system performed well, while traffic-based observation contributed nothing — a pattern consistent with regions where ADS-B-observable traffic density is too low for behavioral signals to register. An operator relying solely on traffic anomalies would have missed essentially every confirmed event in these three FIRs.
Traffic-strong, NOTAM-weak regions
Tehran FIR (OIIX) is the inverse case: 77% of its 43 confirmed events were corroborated by flight-traffic data, but only 49% by NOTAM. Damascus FIR (OSTT), the most disrupted FIR of the period at 511 airspace-days, shows 61% NOTAM and 37% flight-traffic corroboration — meaningful but incomplete coverage from both instruments, with neither reaching three-quarters of events. In FIRs with this profile, a NOTAM-only briefing leaves a substantial fraction of confirmed disruptions undetected.
Full dual-signal coverage
WIIF stands alone at 100% corroboration from both sources across its 20 events and 269 airspace-days — the profile a risk analyst would want everywhere, and the exception rather than the rule in this dataset.
What This Means for Route Planning
The practical conclusion is that no single public signal is sufficient, and which signal fails varies by region. The 78%-vs-42% aggregate gap makes flight-traffic observation the stronger single instrument across the dataset — but the RPHI/UHMM/SEFG profile demonstrates that traffic data alone would produce its own blind spot in low-density airspace. Airspace risk assessment in 2026 is, on this evidence, a multi-signal problem.
Recommendation: operators and flight-planning departments should treat NOTAM review as necessary but not sufficient for the FIRs listed above, and should incorporate at least one independent corroborating source — flight-traffic observation, regulatory advisories, or a consolidated risk feed — before finalizing routings through historically disrupted regions. FlySafe analysis shows that requiring two independent signals per event materially changes which disruptions become visible; the same logic applies to operational review.
Where this dataset does not reach: it contains no cost figures for reroutes, no carrier-level routing decisions, and no specific NOTAM identifiers per event. Those data are not currently available in the collection and no estimates are offered in their place.
Regulatory Context
The formal notice system whose coverage is measured here operates under a defined international framework. ICAO Annex 15 — Aeronautical Information Services — governs the origination and distribution of NOTAMs by state aeronautical information services, and ICAO Annex 11 — Air Traffic Services — defines the FIR structure within which the 66 affected regions in this dataset are organized. The corroboration gap documented above is therefore a measurement of how completely state-issued notices under Annex 15 reflected observed operational reality, not a measurement of any state's compliance with it.
For operators, the obligations run in the other direction regardless of notice completeness. Under 14 CFR §91.703, US-registered aircraft operating outside the United States must comply with the regulations of the states overflown; EU Regulation 965/2012 imposes the operator's own risk-assessment responsibility for air operations on EU-certificated carriers. Where formal state-level restrictions are absent but risk information exists, EASA Conflict Zone Information Bulletins provide advisory-only guidance — a mechanism that exists precisely because the NOTAM system does not carry every category of operational risk information. Current US notices are searchable via the FAA NOTAM system.
The regulatory structure, in short, already anticipates the gap this dataset quantifies: advisory instruments such as CZIBs exist because formal notices are recognized as an incomplete channel.
Recovery Patterns
Every one of the 457 confirmed disruptions in the period had ended as of 2026-07-31, with 250 of them concluding within the last 30 days of the window — consistent with the heavy June–July event concentration. The average confirmed disruption ran approximately 7.9 airspace-days. No disruption in the dataset remained open at the reporting date.
Methodology & Provenance
- Source: FlySafe airspace-risk collectors; observation window 2026-01-01 to 2026-07-31; data as of 2026-07-31.
- Confirmation standard: events are counted only when corroborated by at least two independent signals and carrying an attributed cause. Detections with undetermined causes are excluded from all figures above.
- Inputs: publicly available NOTAMs, EASA publications, FAA temporary flight restrictions, volcanic-ash and seismic advisories, and FlySafe's own ADS-B flight-traffic collection, which serves as the primary corroborating signal.
- Signal-gap computation: corroboration percentages are computed over FIRs with at least three confirmed events in the window.
- Units: an airspace-day is one FIR-level disruption active for one day; overlapping events accumulate independently.
Analysis is based exclusively on publicly available data. FlySafe is not an operational authority; nothing above constitutes flight-planning instruction, and operators must rely on official state AIS products, current NOTAMs, and their own approved procedures for operational decisions.
Key Takeaway
Based on publicly available NOTAMs alone, a route planner in 2026 would have had formal corroboration for roughly 42% of confirmed disruptions in repeatedly affected FIRs — while flight-traffic observation corroborated roughly 78%. Against a year-to-date backdrop of 457 confirmed events and 3,612 airspace-days across 66 FIRs, that gap is not an edge case; it is the central finding. The regions where each signal fails differ, which makes multi-signal corroboration — not a better single source — the defensible standard for airspace risk review.
FlySafe maintains this confirmed-event dataset continuously, applying the same two-signal consensus standard to every detection. Operators and analysts who need FIR-level disruption visibility beyond the formal notice stream can review the full 2026 rankings and methodology at FlySafe.
- NOTAMs corroborated only 42% of confirmed airspace disruptions in affected FIRs, while ADS-B flight-traffic data corroborated 78% of the same events — meaning dispatch workflows relying solely on NOTAMs miss the majority of actual disruptions.
- In 2026 year-to-date, 457 confirmed disruption events were recorded across 66 FIRs totaling 3,612 airspace-days, with July alone (199 events) exceeding the first five months combined.
Powered by B1KEY
Live tools behind the analysis.
The signals FlySafe writes about are also published live — continuously verified by the Sentinel pipeline.
Information is accurate as of the publication date. FlySafe uses exclusively publicly available data.