GNSS Interference over the Gulf North of Sharjah, November 2026: 31 of 39 Aircraft Flag Degraded Navigation off Qeshm on 10 November — the Cell's Largest Sample Since Monitoring Began, Not Its Highest Share
- Sharjah (SHJ), Dubai (DXB) and Ras Al Khaimah (RKT) read normal traffic on their airport pages — GNSS interference degrades navigation avionics, it does not stop flights.
- The high reading is offshore, over Qeshm and the water north of the UAE coast, in a cell that has read high on every well-sampled day since August; what changed on 10 November is that 39 aircraft were seen there, not the share.
- Over the Emirates FIR the stricter jamming-grade measure is lower than in the summer — 4.7% over seven days against 15.2% for July — and what we measure is navigation integrity, not a verdict: go/no-go decisions belong to operators and authorities.
Advisory timeline — how active is this episode
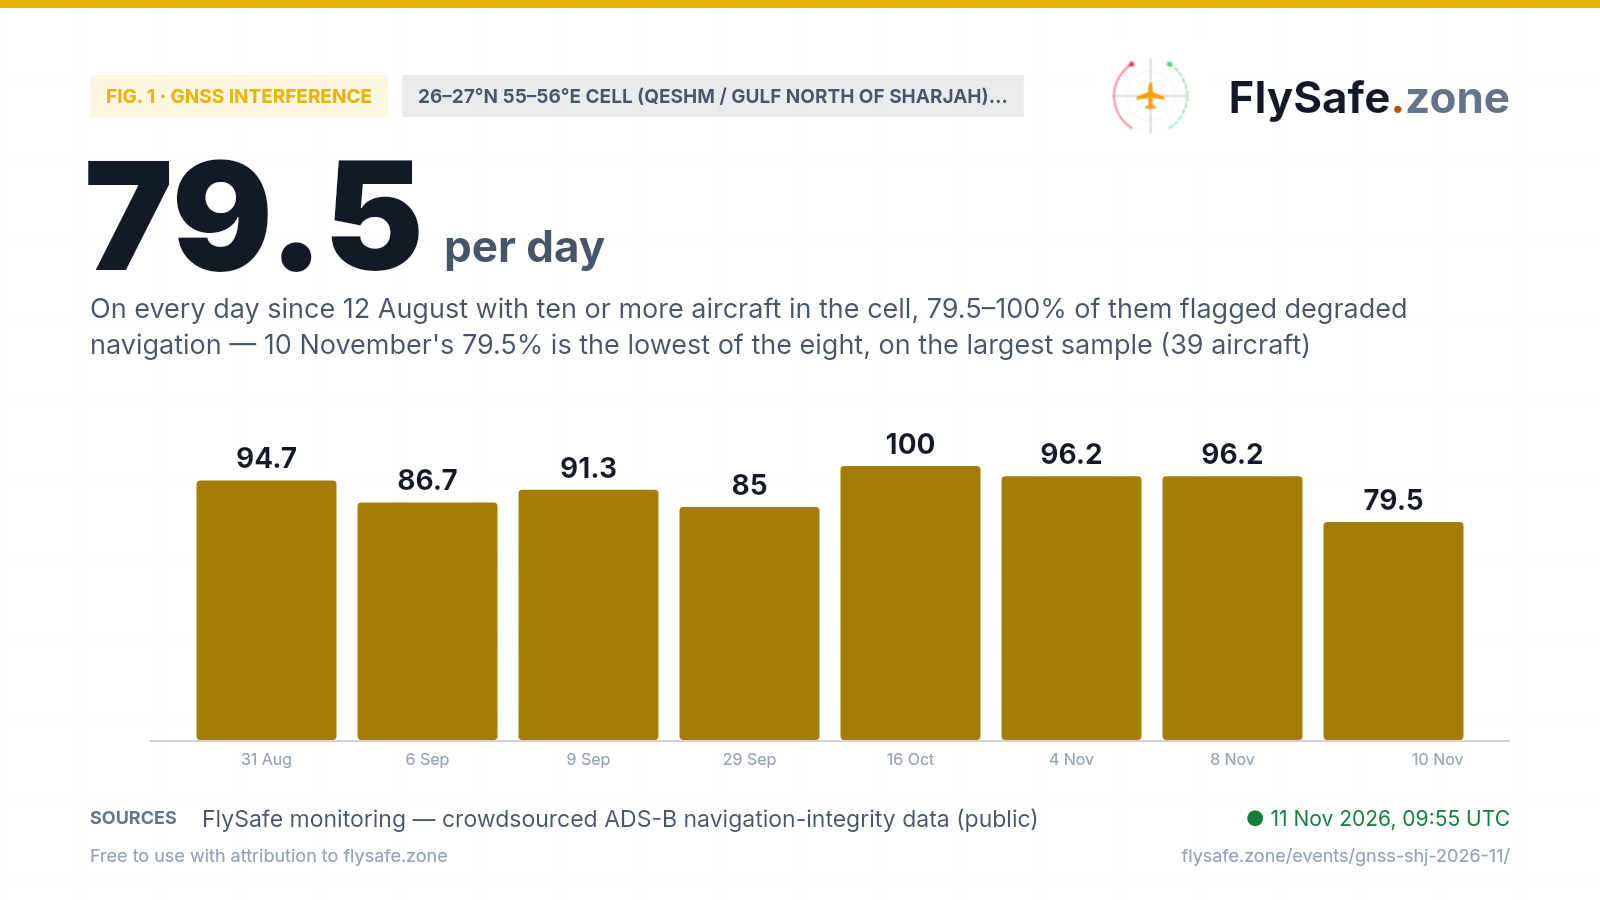
This is not an eruption or a storm. It is a reading from one 1°×1° grid cell — 26–27°N 55–56°E, the water north of Sharjah and Ras Al Khaimah, Qeshm island and the Iranian coast, almost all of it inside the Tehran FIR (OIIX) — where aircraft broadcasting ADS-B report a low navigation-integrity category, the broad flag that their GNSS position confidence has dropped. On 10 November 31 of 39 tracked aircraft (79.5%) carried that flag, which is what our detection layer picked up. The honest context is sample size: this cell usually holds a handful of aircraft a day — 318 across its 76 observed days since 12 August, about four a day — and on 44 of those days every aircraft in it was flagged. 39 is the most it has ever held; the earlier large-sample days were 4 and 8 November (26 each). The chart therefore plots only the eight days with ten or more aircraft, because a 100% on one aircraft is not a measurement. On all eight the share sits between 79.5% and 100%, and 10 November is the lowest of them. The month-by-month picture is flat and high: 90.2% in 12–31 August (37 of 41), 79.5% in September (89 of 112), 83.9% in October (52 of 62), 88.3% in 1–10 November (91 of 103); 84.6% over the whole record. What is new is the number of aircraft seen in the cell, not the share flagged — we do not know whether that reflects routing or receiver reach, and we do not attribute it. 14 September and 6 November are missing from the crowdsourced feed at every cell, and 15 days in all have no aircraft recorded here. Share flagged, days with 10+ aircraft:
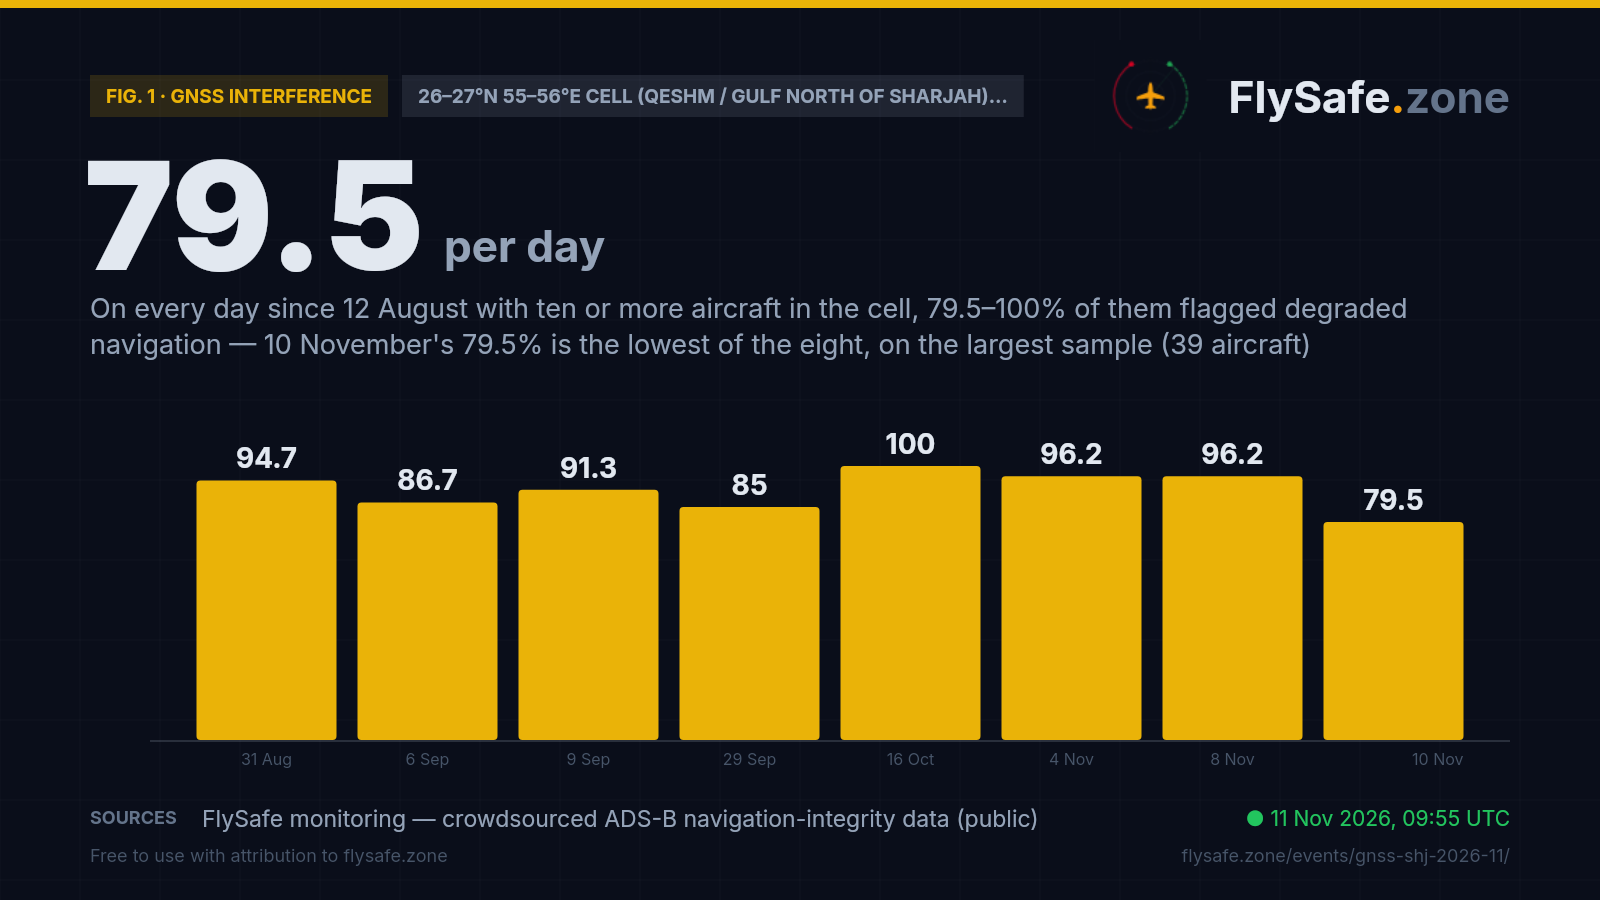
Fig. 1 — daily share of tracked aircraft broadcasting a low Navigation Integrity Category (NIC) in the 26–27°N 55–56°E cell (Qeshm / Gulf north of Sharjah), %, plotted for the eight days since 12 Aug 2026 with 10 or more aircraft in the cell; the other 68 observed days carry 1–9 aircraft and are not plotted — crowdsourced ADS-B network; 14 Sep and 6 Nov feed-wide collection gaps · Data as of 11 Nov 2026, 09:55 UTC · Source: FlySafe monitoring — crowdsourced ADS-B navigation-integrity data (public).
Airports in the exposure zone
| Airport | Size | Distance from cell centre | FIR |
|---|---|---|---|
| Qeshm International Airport (GSM) | small | 49 km · inside the 26–27°N 55–56°E cell · Tehran FIR · no ADS-B movement counts | OIIX |
| Ras Al Khaimah International Airport (RKT) | medium | 108 km · cell 25–26°N 55–56°E 26.9% flagged on 10 Nov (216 of 804) · airport page rates traffic normal | OMAE |
| Bandar Abbas International Airport (BND) | medium | 118 km · Tehran FIR · Iranian side of the strait · no usable ADS-B movement counts | OIIX |
| Sharjah International Airport (SHJ) | large | 130 km · own cell 25–26°N 55–56°E 26.9% flagged on 10 Nov (216 of 804; 29.9% over 7 days) · 266 movements on 10 Nov | OMAE |
| Dubai International Airport (DXB) | large | 140 km · same cell as SHJ, 26.9% on 10 Nov · airport page rates traffic normal | OMAE |
| Fujairah International Airport (FJR) | small | 176 km · own cell 25–26°N 56–57°E 14.3% flagged on 10 Nov (72 of 502; 12.9% over 7 days) | OMAE |
| Al Maktoum International Airport (DWC) | large | 182 km · own cell 24–25°N 55–56°E 16.1% flagged on 10 Nov (105 of 653; 13.2% over 7 days) | OMAE |
Distance alone does not determine impact — wind direction and the flight levels the ash reaches decide which airports and routes are affected on a given day. FIR = Flight Information Region.
What our monitoring shows: Sharjah traffic around the reading
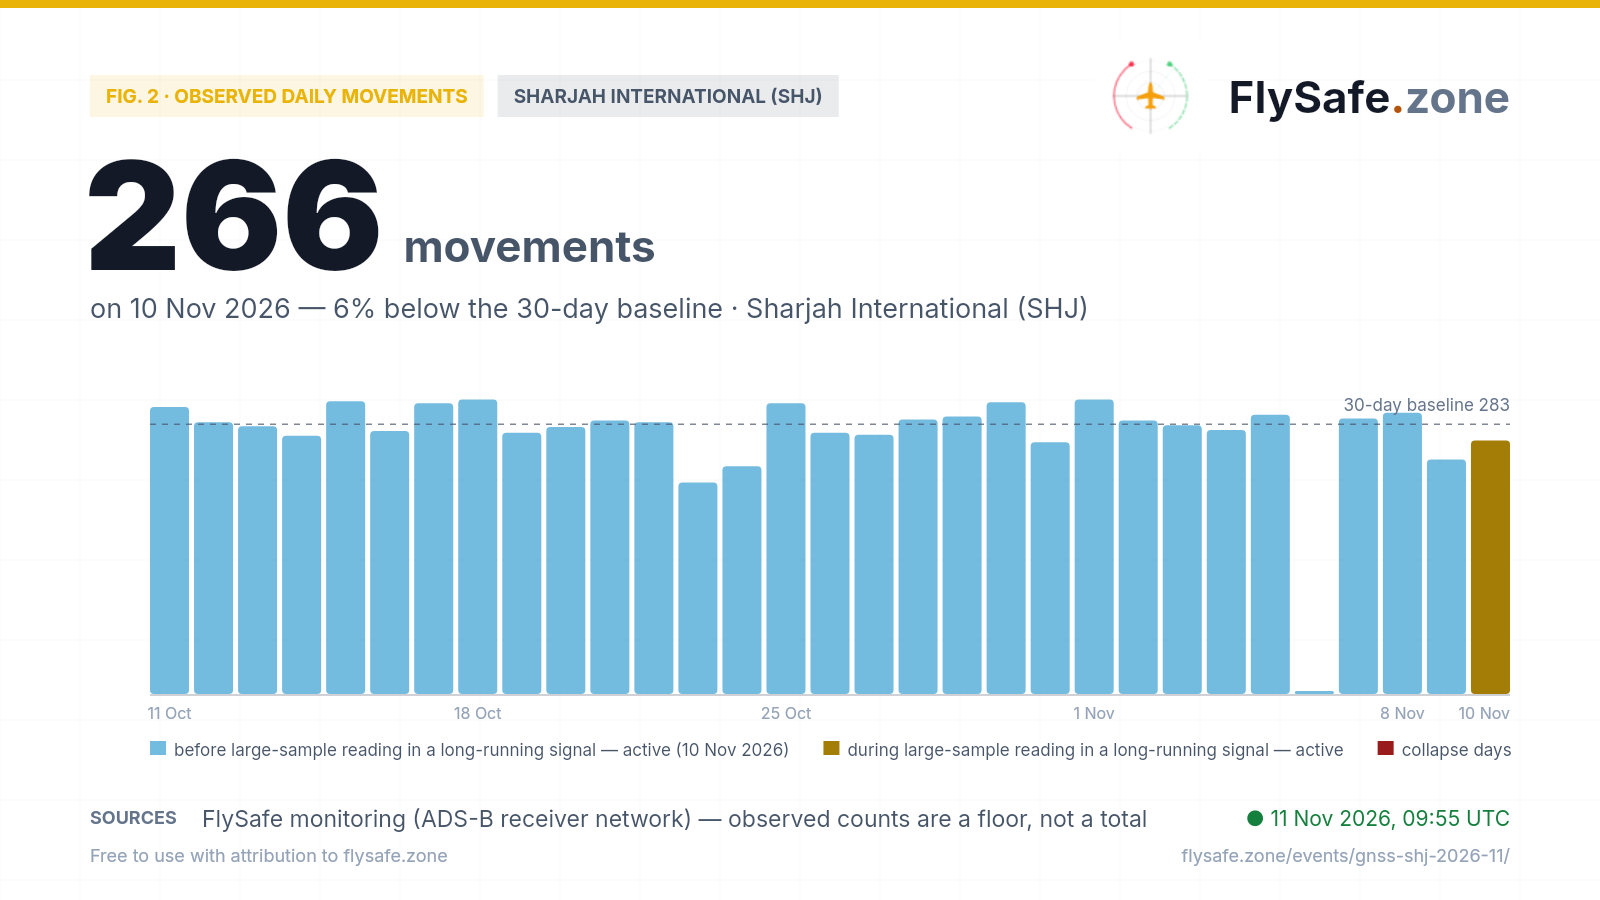
FlySafe tracks observed departures and arrivals at 493 airports from crowdsourced ADS-B receiver data. Observed counts are a floor, not a total — receiver coverage varies — but an airport measured against its own baseline is a reliable shape. Sharjah International's last 30 days:
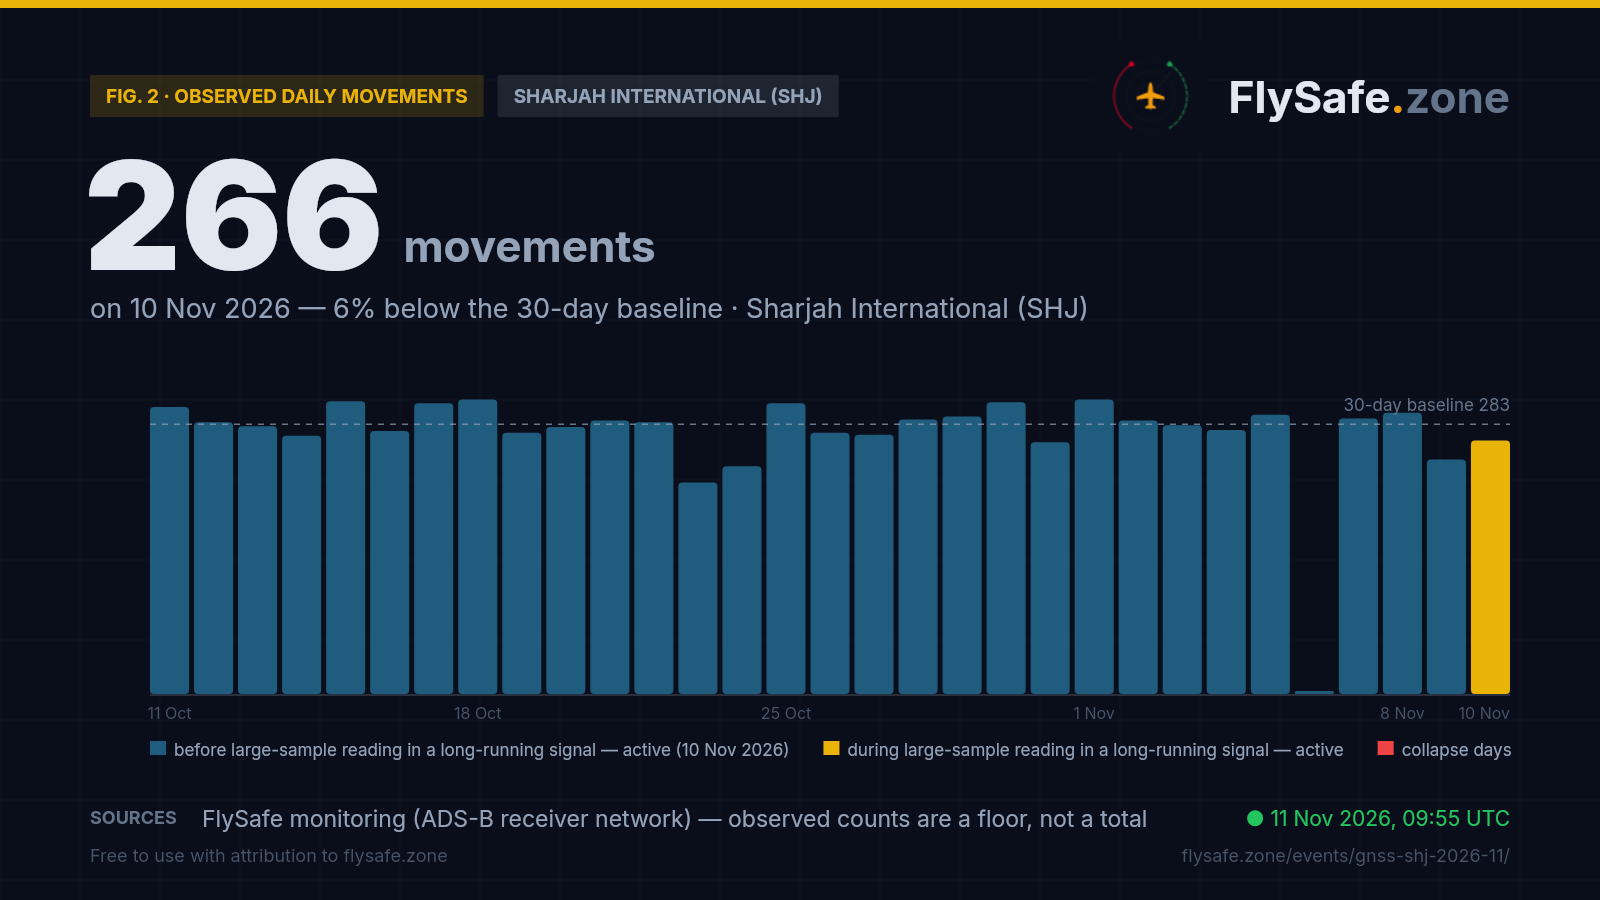
Fig. 2 — Observed daily movements at SHJ, 11 Oct – 10 Nov (latest complete UTC day). Data as of 11 Nov 2026, 09:55 UTC · Source: FlySafe monitoring (ADS-B receiver network).
- Across 11 October–9 November (29 days with data) Sharjah International averaged ~283 observed movements a day on the crowdsourced network plotted here — the reference line on the chart — in a range of 222–309. Observed counts are a floor, not a total.
- Tuesday 10 November, the day of the cell reading — 266 movements (132 departures, 134 arrivals), 6% under the window average and the lowest of the window's five Tuesdays (the others 281, 280, 272 and 282). Monday 9 November read 246 (126/120), the window's lowest Monday (285, 274, 274, 287) and its third-lowest day after 23–24 October (222 and 239). The SHJ airport page, which runs on our primary receiver feed, puts 9 November at 260 and rates it normal (−12% against its Monday reference of 296). We report the two softer days; we do not attribute them.
- Gap day: 6 November is missing from this network at every airport — drawn as a blank stub, not a zero.
- Why this feed: the primary feed reads Sharjah somewhat higher (its seven-day average is 280) but its most recent days are still filling; the network plotted here closes each day the next morning, so 10 November can already be shown complete.
For GNSS interference a traffic gauge is a secondary instrument: jamming and spoofing degrade what avionics compute, not how many aircraft move. It is here to show that a 79.5% low-integrity reading over the Gulf and an ordinary Sharjah day coexist. Live view: SHJ airport brief.
What it means for flights
GNSS interference is a navigation problem, not a runway problem. Ash is an engine problem and wind is a runway problem; jamming and spoofing are a position problem — they corrupt the GNSS fix an aircraft computes. Airliners carry independent navigation sources (inertial reference, DME/DME, VOR) and fly published procedures under ATC surveillance, so degraded GNSS is absorbed rather than grounding traffic. That is why a cell over the Gulf can show four in five aircraft flagging low integrity while Sharjah runs a 266-movement day. The cost is crew workload and reduced margin, not cancelled flights.
Read the 79.5% for what it is: a big sample in a small cell. The 26–27°N 55–56°E cell sits off the main approach paths, so on most days it holds between one and four aircraft, and a 100% there can mean one aircraft. Over its 76 observed days since 12 August it has seen 318 aircraft in total, 269 of them flagged (84.6%). Only eight days carried ten or more aircraft, and all eight read between 79.5% and 100%: 94.7% (18 of 19) on 31 August, 86.7% (13 of 15) on 6 September, 91.3% (21 of 23) on 9 September, 85.0% (17 of 20) on 29 September, 100% (14 of 14) on 16 October, 96.2% (25 of 26) on both 4 and 8 November, and 79.5% (31 of 39) on 10 November. So the detection fired on a real reading, but the reading says the cell is as it has been — high — on more aircraft than before. Three of the four largest samples fell in the last seven days (4, 8 and 10 November); the seven-day share is 87.5% (84 of 96 on five observed days).
Closer to the airports the signal is lower, and lower than in summer. The low-integrity flag is broad; how high it reads depends on where the cell is. Sharjah's own cell, 25–26°N 55–56°E (which also holds Dubai and Ras Al Khaimah), read 26.9% on 10 November (216 of 804 aircraft) and 29.9% over seven days — down from 58.1% for August, 35.5% for September and 33.6% for October. Its two highest November days were 4 November (47.0%) and 8 November (45.7%) — the same two days the offshore cell had 26 aircraft — while the other November days read 12.0–29.4%. The Fujairah cell (25–26°N 56–57°E) reads 12.9% over seven days against 56.1% in August, and the Al Maktoum cell (24–25°N 55–56°E) 13.2% against 49.6%. These are cell-level aggregates of aircraft telemetry, not per-flight figures.
The FIR-level picture: Emirates down since July, Tehran a little above its average. The stricter jamming-grade ratio is a FIR-level aggregate, labelled as such. Over the Emirates FIR (OMAE) it read 5.40% on 10 November (of about 14,700 tracked aircraft) — November's third-highest day after 4 November (8.36%) and 8 November (6.98%) — with a seven-day mean of 4.7%, a 90-day mean of 6.1% and a 14-day range of 1.2–9.5%. Its monthly mean has fallen each month since July: 15.2% in July, 7.8% in August, 5.9% in September, 5.0% in October and 4.7% for 1–10 November (25 October is missing from the FIR feed). The Tehran FIR (OIIX), which contains most of the cell, read 5.26% on about 1,500 tracked aircraft — a tenth of the Emirates sample — with a seven-day mean of 3.9% against a 90-day mean of 3.2%, inside its three-week range of 1.5–8.1%. The Muscat FIR (OOMM) on the Musandam side read 1.4% (seven-day 1.3%), the Bahrain FIR (OBBB) 1.5% (seven-day 2.9%).
What the published notices say. The current Emirates FIR NOTAM set (91 notices, collected through 11 November 09:31 UTC) carries no notice for Sharjah and no GNSS or GPS notice. The RNAV departure and arrival procedures it does suspend are at Abu Dhabi (A3628/26–A3630/26, set windows from 11 November to 2 December), and they cite a temporary restricted area, not navigation interference. In the Tehran FIR the GPS-unreliable notices A2433/26 and A2435/26 cover the Tehran terminal area, more than 1,000 km north of this cell; the Bahrain FIR carries a standing GPS-interference advisory, A0291/26, to 30 December. Absence from our notice set is not proof that no restriction exists — operators work from their own briefing packages.
What would change this story. A further high share in the offshore cell would not, on its own: it has read high on every well-sampled day for three months, and on samples this size one or two aircraft move the figure by several points. The tests we are watching instead: the Emirates-FIR seven-day jamming-grade mean back above 9.5%, the top of its 14-day range; Sharjah's own cell above 45% on consecutive days (it has reached that on single days, 4 and 8 November); a NOTAM series suspending GNSS-based procedures at Sharjah or Dubai; or diversions and go-arounds attributable to lost navigation. Our automated multi-signal analysis checks the navigation-integrity streams against notice and traffic signals every three hours, and this page and the SHJ brief update from the same cycle. If none of the tests fires, the brief closes as a documented steady state.
Passenger questions, answered from the data
Airliners navigate with several independent systems, not GNSS alone, and the Emirates airports were operating normally as of 11 November 2026 — Sharjah (SHJ) handled 266 movements on 10 November against a ~283 average for the previous month, and the Dubai and Ras Al Khaimah airport pages rate traffic normal. We publish the measured picture — navigation-integrity shares and throughput; routing and go/no-go decisions belong to operators and authorities. Check your airline's status on the day of travel.
Aircraft broadcast a Navigation Integrity Category with their ADS-B position — a statement of how much the avionics trust their own GNSS fix. A low value is a broad flag that the fix is degraded, which is what jamming (drowning out satellite signals) or spoofing (broadcasting false ones) produces. Crews cross-check against inertial and ground-based navigation and follow ATC, so passengers do not normally notice it; it raises workload rather than causing cancellations, and Gulf traffic has continued through months of it.
Not on the measures that cover the most aircraft. The 79.5% reading on 10 November comes from an offshore cell north of Sharjah that has read 79.5–100% on every day since August with ten or more aircraft in it; what was new was the number of aircraft (39), not the share. Sharjah's own cell read 26.9% that day, down from 58.1% for August, and the stricter FIR-level jamming-grade ratio over the Emirates FIR has a seven-day mean of 4.7% against a monthly mean of 15.2% in July. These are cell- and FIR-level aggregates from aircraft telemetry, reported as a floor from the crowdsourced receiver network.
For media — the full kit
Everything on this page — charts, CSV, quotes — is published under CC BY 4.0: free to reuse with attribution to FlySafe.zone. Charts come in dark (social/web) and light (print/light layouts) versions; attribution and license are embedded in every file.
“In the grid cell over the Gulf north of Sharjah, 31 of 39 tracked aircraft broadcast degraded GNSS navigation integrity on 10 November — the largest sample that cell has produced since monitoring began in August, though not its highest share — while Sharjah's own cell read 26.9%, the Emirates FIR's jamming-grade ratio stood at 5.4% and Sharjah International handled a normal 266-movement day, according to flight-monitoring service FlySafe.zone.”
Boilerplate — about the source (for your article footer)
FlySafe.zone monitors airspace risk and observed airport activity worldwide: 334 flight-information regions scored daily, GPS-interference signals, volcanic-ash exposure and daily observed movements at 493 airports from the crowdsourced ADS-B receiver network. Methodology: flysafe.zone/methodology.
Need a different cut of the data, a comment, or numbers for another airport? Leave an email — we answer fast during active events.