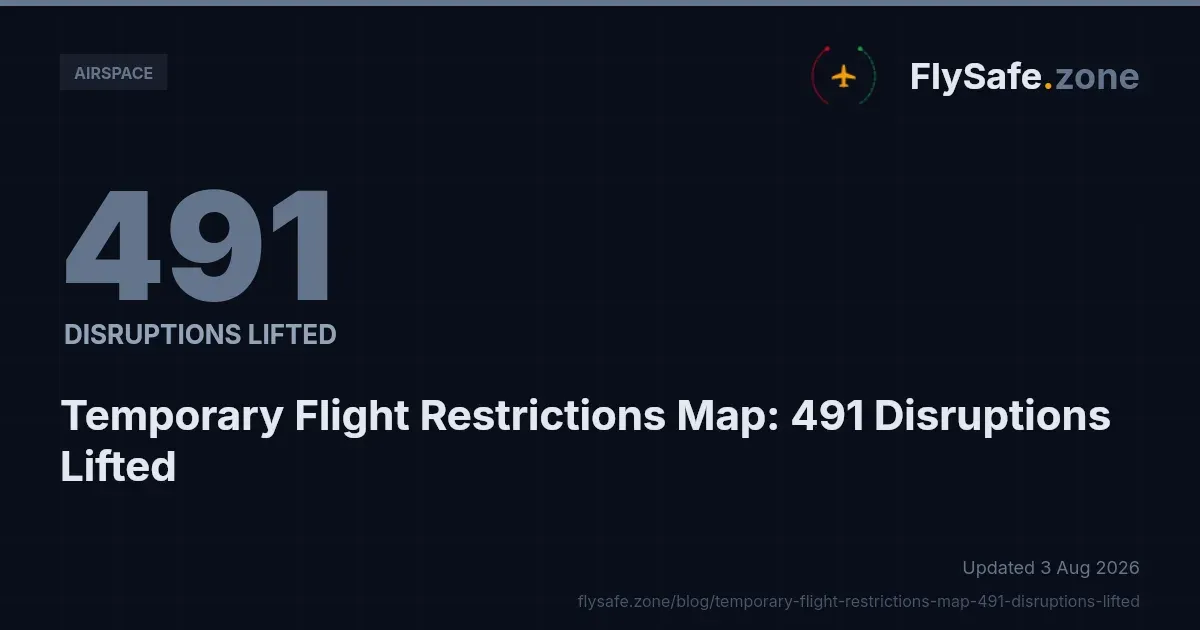
Every one of the 491 confirmed airspace-disruption events recorded by FlySafe between 1 January and 3 August 2026 has now ended, with 265 of those recoveries occurring in the last 30 days alone. For dispatchers who track a temporary flight restrictions map as part of daily route planning, the year-to-date picture is one of high event volume but short event life: the average confirmed disruption ran approximately 8.1 airspace-days before lifting. This bulletin summarizes what the recovery data shows, which flight information regions (FIRs) absorbed the greatest share of disrupted airspace-days, and what the corroboration record implies for operational monitoring. All figures are drawn from FlySafe airspace-risk collectors, data as of 2026-08-03.
The 2026 Recovery Picture: All Confirmed Disruptions Have Ended
Across the reporting window, FlySafe confirmed 491 airspace-disruption events spanning 68 FIRs, totaling 3,990 airspace-days of disrupted operations. As of 3 August 2026, 491 of 491 confirmed disruptions have ended — no confirmed event in the dataset remained active at the data cut-off.
Two features of the recovery record stand out:
- Short typical duration. The average confirmed disruption lasted approximately 8.1 airspace-days. Most restrictions that appear in the dataset lifted within days, not months.
- Recent recovery concentration. 265 of the 491 endings — more than half — occurred within the last 30 days of the window, reflecting the heavy event volume recorded in June and July.
The monthly confirmed-event trend shows how sharply detection volume rose through mid-year: January 5, February 16, March 1, April 21, May 72, June 143, July 228, and 5 events in the first three days of August. The July figure alone accounts for nearly half of all confirmed events year-to-date. That the entire July cohort has already resolved is consistent with the short average duration observed across the dataset.
Only events meeting FlySafe's confirmation bar are counted: at least two independent signals and an attributed cause. Detections with undetermined causes are excluded, so the 491 figure is a conservative floor, not a ceiling.
Where the Airspace-Day Burden Concentrated
Six FIRs account for a disproportionate share of the 3,990 total airspace-days. The table below lists the most disrupted FIRs by airspace-days, with the share of events corroborated by each signal type (FlySafe collectors, as of 2026-08-03):
| FIR | Events | Airspace-days | Flight-traffic corroboration | NOTAM corroboration |
|---|---|---|---|---|
| Damascus FIR (OSTT) | 54 | 556.0 | 35% | 63% |
| RPHI | 35 | 462.0 | 0% | 94% |
| UHMM | 24 | 304.0 | 0% | 96% |
| WIIF | 22 | 287.0 | 100% | 100% |
| Tehran FIR (OIIX) | 43 | 283.0 | 77% | 49% |
| SEFG | 18 | 270.0 | 0% | 100% |
The corroboration mix varies widely by region. WIIF events were confirmed by both flight-traffic and NOTAM signals in every case, while RPHI, UHMM, and SEFG events were confirmed almost entirely through NOTAM issuance with no flight-traffic corroboration. Tehran FIR (OIIX) shows the inverse pattern: 77% of its events were corroborated by observed flight-traffic changes, but only 49% by NOTAM. A fuller ranking of disrupted regions is available in FlySafe's review of 2026's most-disrupted FIRs by NOTAM data.
All confirmed events in these FIRs, as elsewhere in the dataset, had ended by the 3 August data cut-off.
What Drove the Disruption-Days: Operational Categories
By airspace-days, the 2026 confirmed-event mix breaks down into neutral operational categories as follows (FlySafe collectors, as of 2026-08-03):
- Volcanic ash — 55% (2,197 airspace-days across 195 events). The single largest category by both days and event count.
- Conflict-zone restrictions — 32% (1,266 airspace-days across 185 events).
- Seismic activity — 8% (300 airspace-days across 43 events).
- Tropical cyclones — 3% (130 airspace-days across 22 events).
- Other regulatory restrictions — 2% (97 airspace-days across 46 events).
Natural-hazard categories — volcanic ash, seismic activity, and tropical cyclones — together account for roughly two-thirds of all disrupted airspace-days in 2026. The dataset does not attribute individual FIR totals to specific causes, and no such attribution is made here.
Why NOTAM-Only Monitoring Understates Both Disruption and Recovery
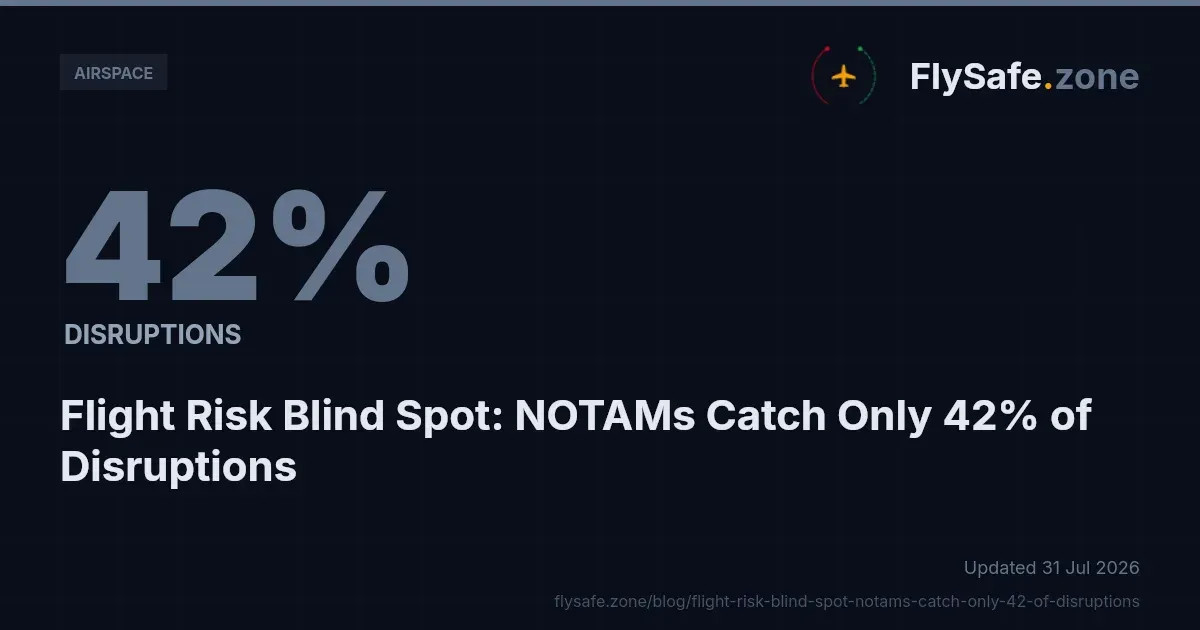
Among FIRs with at least three confirmed events, flight-traffic data corroborated approximately 77% of events, while NOTAMs corroborated approximately 42%. A monitoring posture based on publicly available NOTAMs alone would therefore have missed the majority of confirmed disruptions in 2026 — a gap examined in detail in FlySafe's analysis of why NOTAMs miss most airspace disruptions.
The same gap cuts both ways during recovery. Where a disruption was never captured in NOTAM issuance, its ending will not be visible through NOTAM cancellation either. Observed flight-traffic normalization — traffic returning to previously affected volumes — is frequently the earlier and, in some regions, the only public signal that a disruption has lifted. The RPHI, UHMM, and SEFG records show the opposite case: NOTAM-driven confirmation with no traffic corroboration, meaning NOTAM status remains the primary recovery indicator there.
Recommendation: operators monitoring airspace availability should treat NOTAM review and traffic observation as complementary, not interchangeable. Neither signal alone covered the full 2026 event set.
Route-Planning Implications of Recovery
For flight-planning departments, three operational conclusions follow from the 2026 recovery data:
- Reinstatement decisions deserve the same rigor as avoidance decisions. With an average disruption life of ~8.1 airspace-days, restrictions in the 2026 dataset lifted quickly. Route structures avoided in one planning cycle may be available in the next. Current NOTAM status and corroborating traffic data should be verified before reinstating previously avoided routings.
- Short average duration does not imply low recurrence. The most disrupted FIRs recorded repeated events — Damascus FIR (OSTT) logged 54 separate confirmed events, Tehran FIR (OIIX) 43. A lifted restriction in a high-frequency FIR is not equivalent to a stable operating environment; monitoring should continue after recovery.
- Detection volume rose sharply through mid-year. The June–July surge (371 combined events) means planning assumptions formed in the first quarter understate the operating tempo seen since May.
Honest gaps in the data should be stated plainly: the dataset does not include cost impacts of the disruptions, does not list individual NOTAM identifiers per event, and does not contain carrier-level rerouting records. No figures on those dimensions are currently available, and none are offered here.
Regulatory Context
Several public frameworks govern how the disruptions and recoveries described above are promulgated and consumed:
- ICAO Annex 11 (Air Traffic Services) establishes the FIR structure within which all events in this dataset are recorded, and the responsibility of states to provide air traffic services within their FIRs.
- ICAO Annex 15 (Aeronautical Information Services) governs the NOTAM system through which temporary restrictions are published and cancelled — the mechanism by which roughly 42% of the confirmed events in multi-event FIRs were corroborated. NOTAM standards and distribution are described by ICAO.
- EASA Conflict Zone Information Bulletins (CZIBs) provide advisory-only risk information for affected regions where no state-level restriction may exist; current bulletins are published by EASA. Where a CZIB is advisory only and not adopted by a state CAA via NOTAM, it does not itself restrict airspace.
- EU Regulation 965/2012 (Air Operations) places the obligation on European operators to assess operational risk along planned routes, which includes evaluating disrupted or recently recovered airspace.
- 14 CFR Part 91 and the FAA temporary flight restriction system govern US-issued restrictions; the FAA publishes an authoritative graphical temporary flight restrictions map and list for US airspace.
Key Takeaway
The 2026 year-to-date record — 491 confirmed events, 3,990 airspace-days, 68 FIRs — resolves into a single recovery fact: every confirmed disruption had ended by 3 August 2026, at an average life of ~8.1 airspace-days. The operational burden was concentrated in six FIRs and dominated by volcanic ash and conflict-zone restriction categories, and the majority of events would not have been visible through NOTAM review alone. FlySafe analysis shows that recovery, like disruption, is a multi-signal question: traffic data confirmed events NOTAMs never carried, and vice versa.
Methodology & Provenance
FlySafe's consensus engine confirms an airspace-disruption event only when at least two independent signals agree and a cause can be attributed; detections with undetermined causes are excluded from all figures above. FlySafe's own ADS-B flight-traffic collection serves as the primary corroborating signal, alongside public NOTAM data, EASA advisories, FAA temporary-restriction publications, and volcanic-ash and seismic advisories. All analysis is based exclusively on publicly available, independently verifiable data; no non-public information is accessed or used. Reporting window: 2026-01-01 through 2026-08-03; data as of 2026-08-03.
FlySafe is not an operational authority. This bulletin is informational analysis and does not replace official NOTAM briefings, AIP consultation, or state CAA guidance. Operators should verify current airspace status through official channels before flight.
For continuous multi-signal monitoring of airspace disruptions and recoveries across all 68 affected FIRs and beyond, FlySafe's risk intelligence platform provides confirmed-event tracking built on the same consensus methodology described above.
- All 491 confirmed airspace disruptions recorded year-to-date have ended, with an average duration of roughly 8.1 airspace-days — indicating that most restrictions in the dataset lifted within days rather than weeks or months.
- Event detection volume rose sharply through mid-year: July alone produced 228 confirmed events, nearly half of the full-year total, yet the entire July cohort has already resolved — consistent with the short observed durations.
- Flight-traffic corroboration varies widely by region — RPHI, UHMM, and SEFG showed 0% flight-traffic corroboration despite high NOTAM coverage, meaning single-source NOTAM monitoring would be the only signal available to operators in those FIRs.
- The 491 figure is a conservative floor: FlySafe's confirmation threshold requires at least two independent signals and an attributed cause, so disruptions with undetermined causes are excluded from the count entirely.
Powered by B1KEY
Live tools behind the analysis.
The signals FlySafe writes about are also published live — continuously verified by the Sentinel pipeline.
Information is accurate as of the publication date. FlySafe uses exclusively publicly available data.