Ahmedabad (AMD) Traffic ‘Drop’ of −72% on Sunday 1 November 2026 — the Airport Went Silent in Our Feed at 08:00 UTC, and We Cannot Measure It
- The −72% on 1 November is a gap in our own feed, not evidence of fewer flights. Ahmedabad’s records stop at 08:00 UTC, while flights bound for Ahmedabad kept departing Delhi, Bengaluru, Mumbai and other cities at their usual rate.
- Weather reports showed routine haze and mist with light winds, and no closure signal registered in the Mumbai FIR (VABF). We found nothing in any layer that points to an operational stoppage.
- Until the records come back we cannot say how many flights operated. Observed counts are a floor, not a total — for a specific flight, check your airline or the airport.
Advisory timeline — how active is this episode
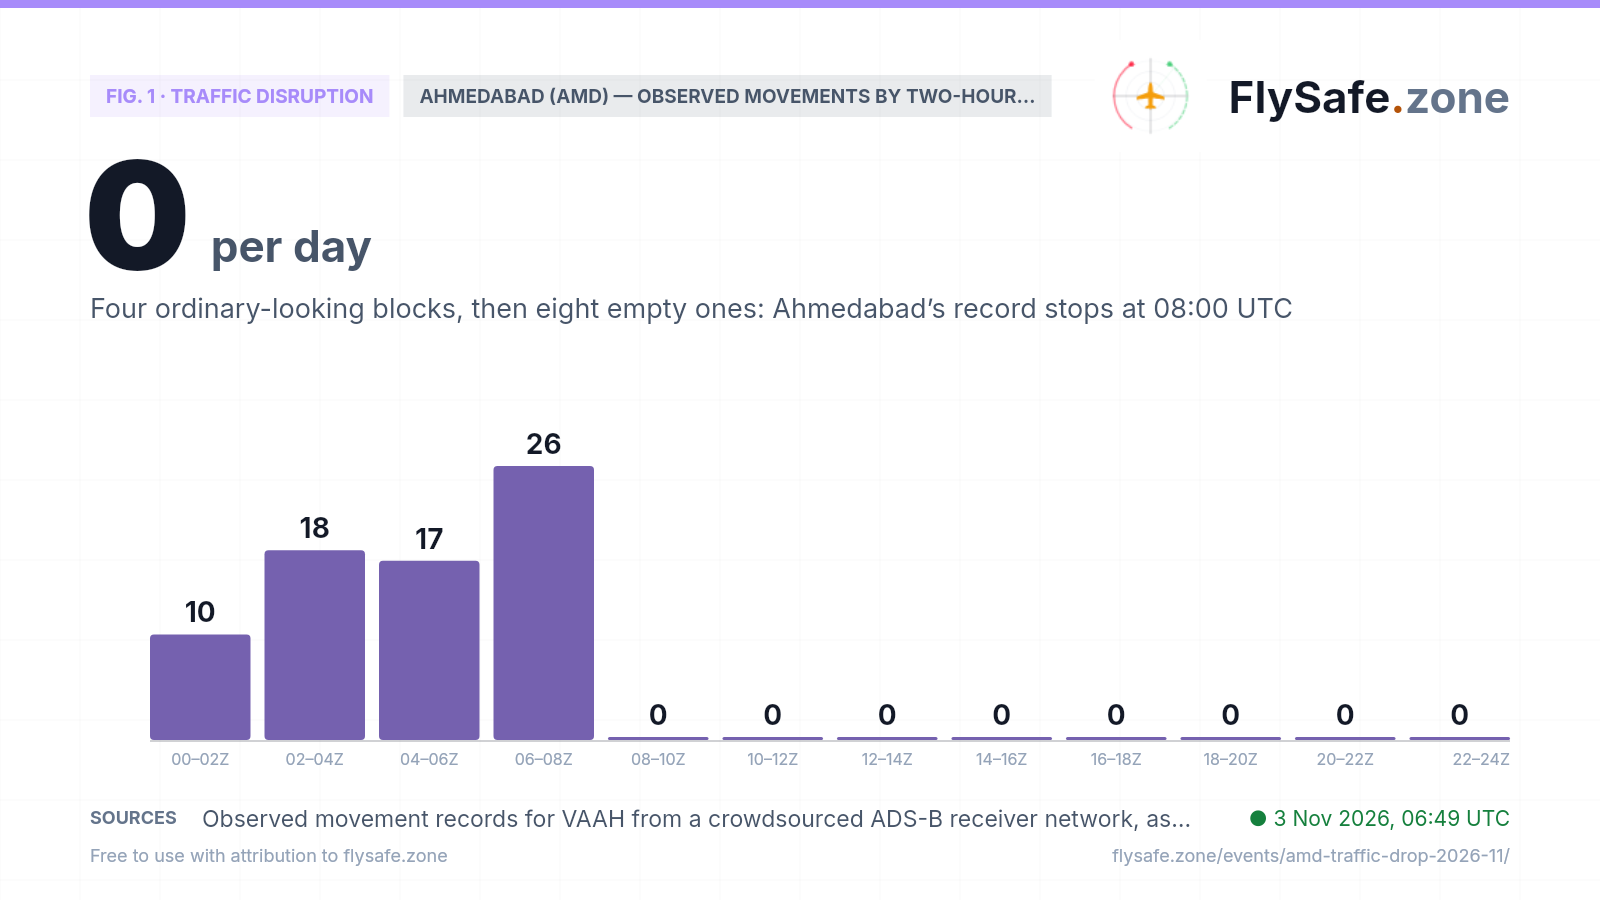
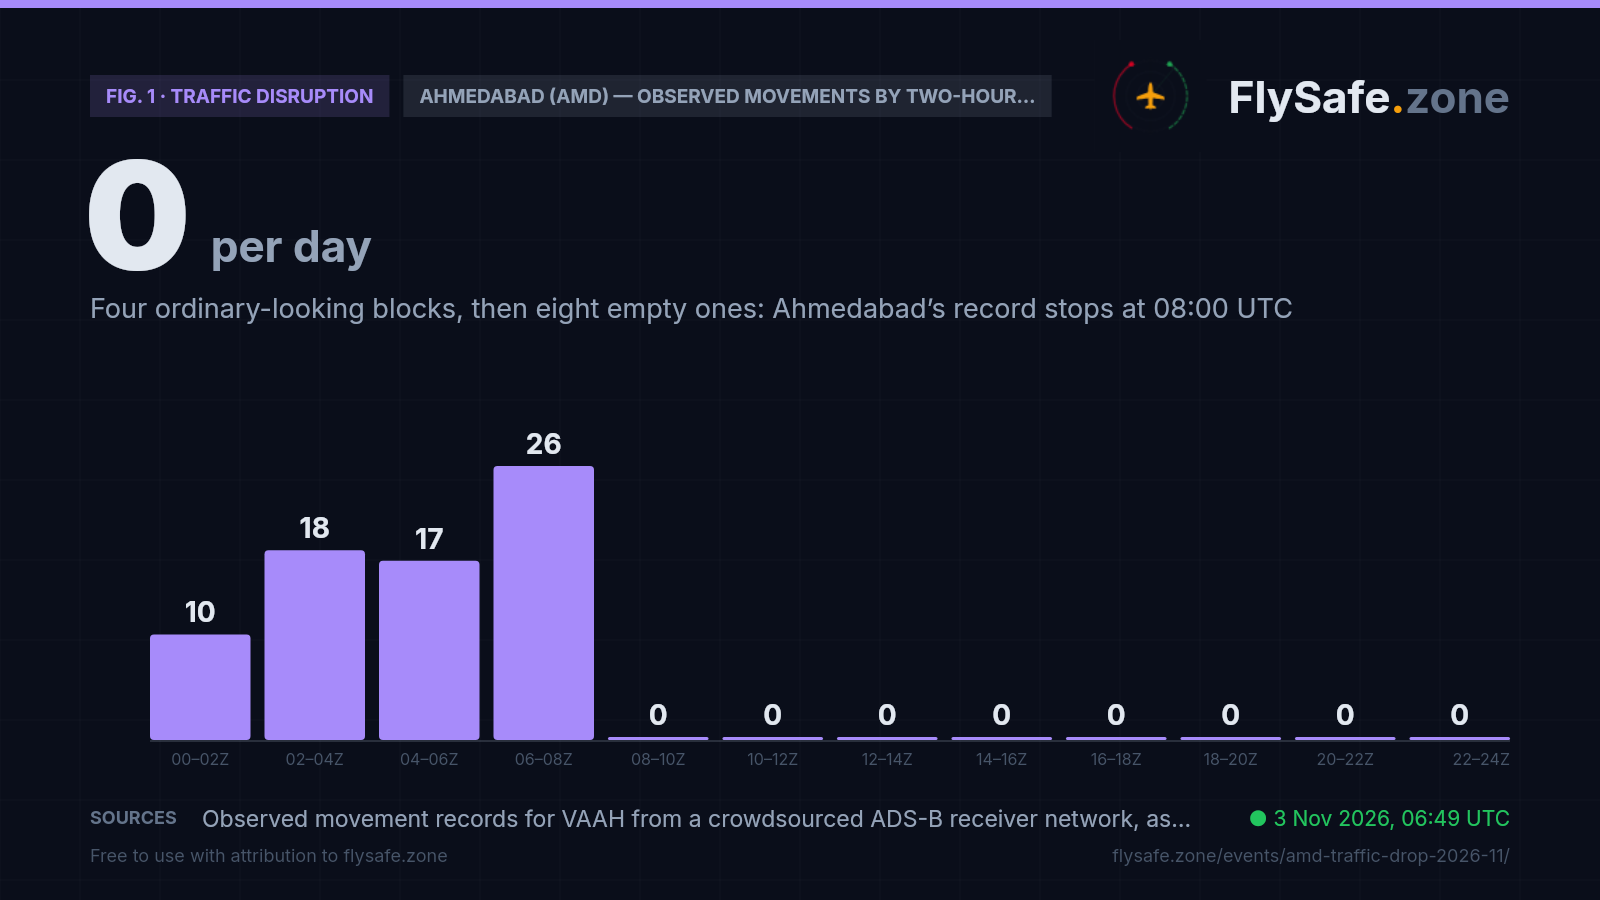
This chart splits Ahmedabad’s 1 November count into two-hour UTC blocks (Ahmedabad is UTC+5:30, so 08:00 UTC is 13:30 local). From midnight to 08:00 UTC our feed recorded 71 movements — thinner than the ~105 of the same hours on 25–30 October, but a working airport by any reading. From 08:00 UTC to midnight it recorded none, in eight blocks that normally carry 8 to 27 movements each. A traffic fall caused by weather or a disruption thins blocks unevenly and leaves a trickle; a record that drops to zero mid-afternoon across both departures and arrivals is the signature of a signal that stopped:
Fig. 1 — Observed departures + arrivals at Ahmedabad (AMD) in each two-hour UTC block of Sunday 1 November 2026; the 25–30 October average for the same blocks is 26 / 28 / 24 / 27 / 14 / 19 / 26 / 27 / 26 / 23 / 8 / 10 · Data as of 3 Nov 2026, 06:49 UTC · Source: Observed movement records for VAAH from a crowdsourced ADS-B receiver network, as collected by FlySafe monitoring.
Airports in the exposure zone
| Airport | Size | Observed signal | FIR |
|---|---|---|---|
| Sardar Vallabh Patel International Airport (AMD) | large | — · 1 Nov: 71 observed movements (46 dep / 25 arr), all before 08:00 UTC, −72% vs ~258; 23 of 26 AMD-bound flights with no recorded landing; 2 Nov: 1 record | VABF |
| Vadodara International Airport (BDQ) | medium | 102 km · Second network: no record on 1 Nov, after 8–23 a day on 25–31 Oct — the coverage loss reaches beyond Ahmedabad | VABF |
| Chhatrapati Shivaji Maharaj International Airport (BOM) | large | 444 km · Separate partial coverage gap since 25 Oct (own brief); evening records back on 1 Nov | VABF |
| Indira Gandhi International Airport (DEL) | large | — · Control: 900 departures on 1 Nov vs 921–960 on 25–31 Oct; Ahmedabad-bound flights still departing | VIDF |
Distance alone does not determine impact — wind direction and the flight levels the ash reaches decide which airports and routes are affected on a given day. FIR = Flight Information Region.
What our monitoring shows: a stable month, then a record that thins and stops
FlySafe tracks observed departures and arrivals at 493 airports from crowdsourced ADS-B receiver data. Observed counts are a floor, not a total — receiver coverage varies — but an airport measured against its own baseline is a reliable shape. Sardar Vallabh Patel International Airport's last 30 days:
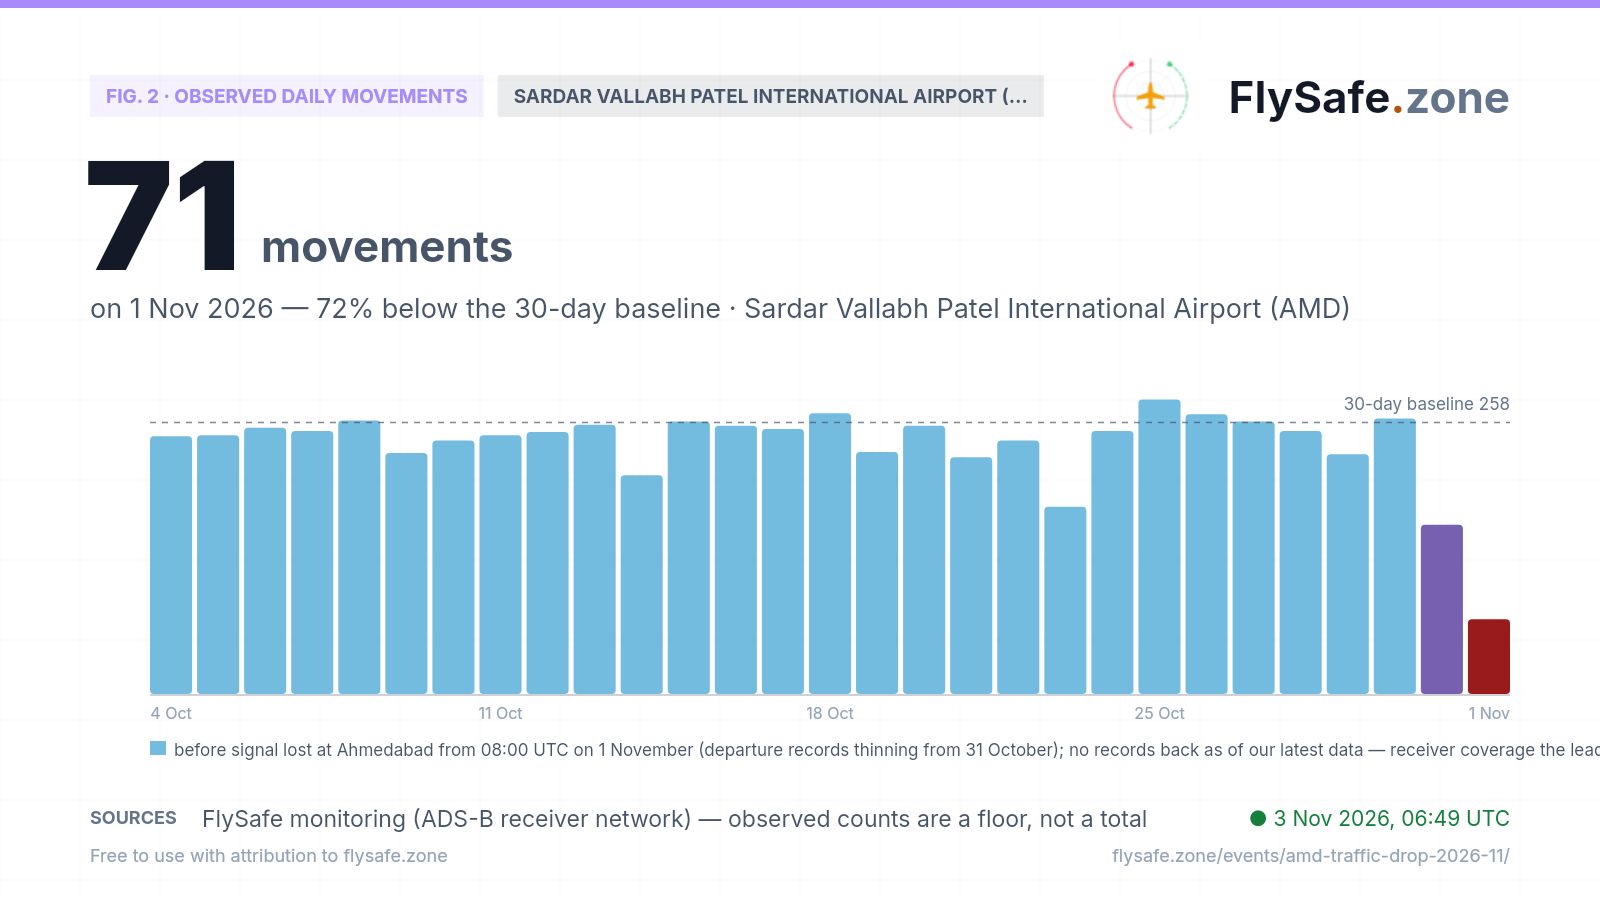
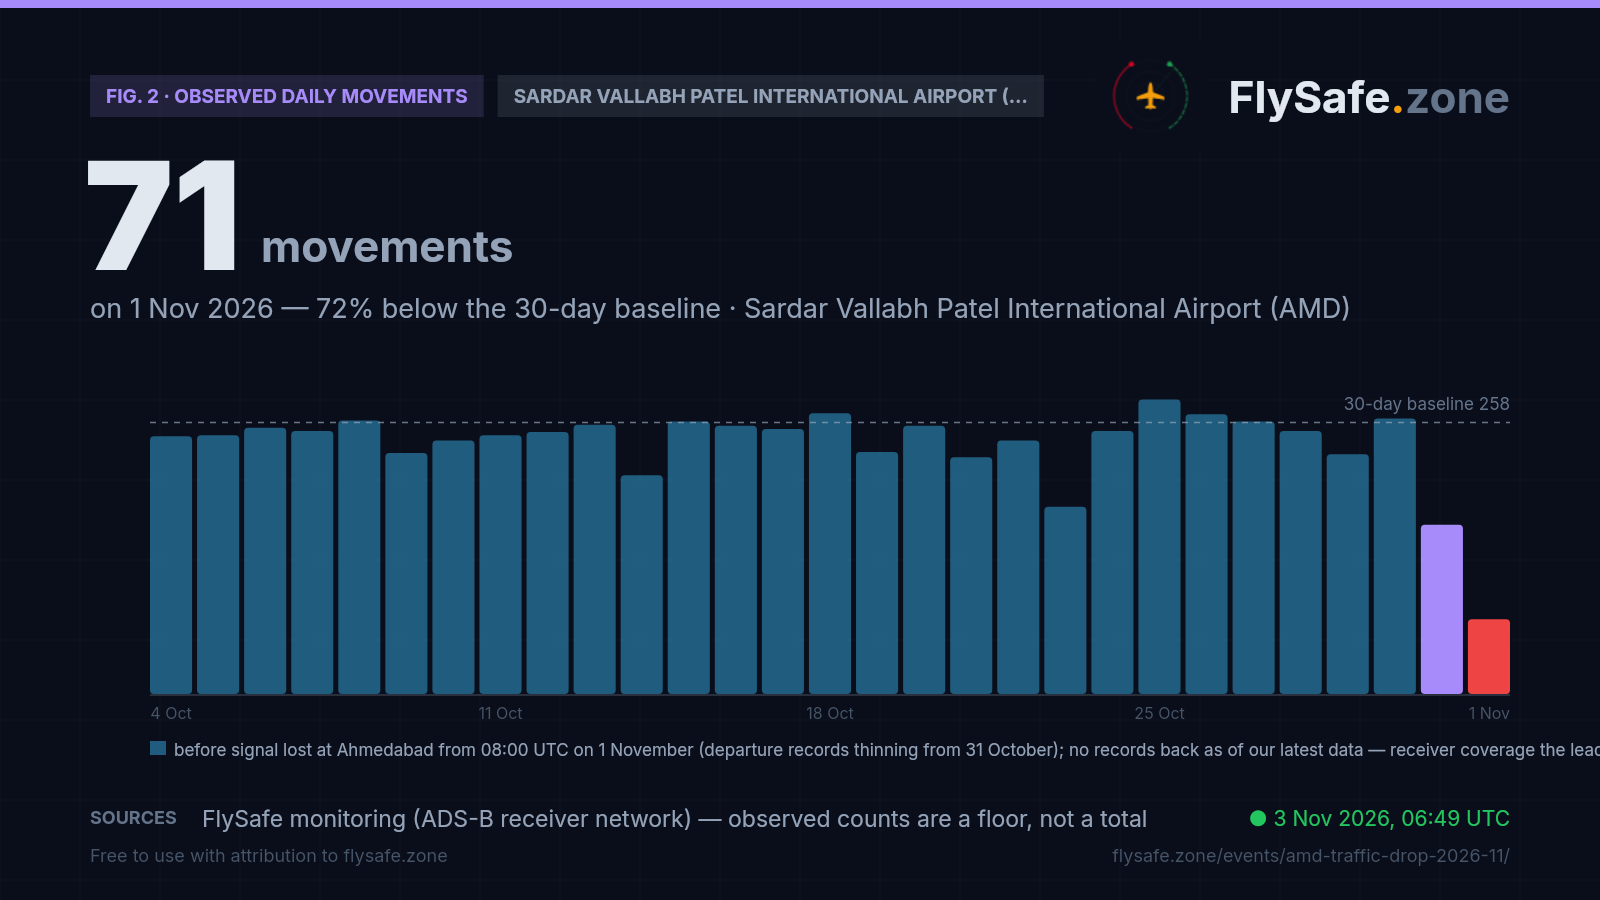
Fig. 2 — Observed daily movements at AMD, 4 Oct – 1 Nov (latest complete UTC day). Data as of 3 Nov 2026, 06:49 UTC · Source: FlySafe monitoring (ADS-B receiver network).
- Baseline = 25–30 October, the first six days of the winter timetable: 280, 266, 259, 250, 228 and 262 observed movements, ~258 a day. Across 4–30 October the airport read between 208 and 280 on every day but one (178 on 23 October, a day on which departure records also thinned). Sunday 1 November came in at 71 — −72% against that baseline (46 departures, 25 arrivals). Detection fired at −66% against a seven-day rolling average of ~210 that already included a partly recorded 31 October.
- The two last bars are coverage-gap days, not traffic readings. 31 October is plotted from a recount of the raw flight records, 161 (65 departures, 96 arrivals; the stored rollup of 107 was clipped by a routine refresh): arrivals ran close to normal, departures at about 40% of the 133–159 of 25–30 October. 1 November is plotted as recorded — 71 movements, all before 08:00 UTC. Neither is a whole day at the airport, and neither should be read as one.
- 2 November is not plotted: one departure record so far (04:54 UTC), and no arrival. The day has been through one nightly ingest; even so, the same night carried tens of thousands of records elsewhere.
- Not a feed-wide collection gap. Network-wide, 1 November holds 114,337 takeoff records, above our 60% gap rule but softer than recent days, and Delhi departures read 900 against 921–960 on 25–31 October. Ahmedabad’s fall is out of all proportion to that softness.
Observed counts are a floor, not a total — they measure what our receivers heard, and they are meaningful only while coverage holds. Here it did not. Live view: AMD airport brief.
What it means for flights
What fired, and why we do not read it as a traffic drop. Our detection layer flagged AMD when Sunday 1 November came in at 71 observed movements against a rolling seven-day average of ~210 — a −66% traffic anomaly; against the ~258 a day of 25–30 October it is −72%. A drop that size can be an operational event or a failure of the instrument, so automated multi-signal analysis checks it against every other layer we track before anything is claimed. Here the layers line up on the instrument, as at Mumbai in October: the count does not thin, it stops — all 71 records fall before 08:00 UTC, and the eight two-hour blocks after that, which normally carry 8 to 27 movements each, are empty for departures and arrivals alike.
The flights kept flying — they dropped out of view near Ahmedabad. The test that separates a real drop from lost coverage is continuity. We took the 50 callsigns that landed at Ahmedabad from nine major origins (Delhi, Bengaluru, Mumbai, Kolkata, Chennai, Hyderabad, Kochi, Dubai, Abu Dhabi) on at least two days of 25–30 October, and counted their departures from those origins after 06:00 UTC each day. On 1 November they departed 26 times, against 28–35 a day on 25–31 October — the origin airports saw them go. On the earlier days 24–34 of them were recorded landing at Ahmedabad; on 1 November 0 were, and 23 ended with no recorded destination at all, against 0–1 on most days (6 on 29 October). On 2 November, after one ingest night, it is 22 departures, none recorded landing, 21 with no destination. The outbound side reads the same way: callsigns that usually depart Ahmedabad were seen in the air with no recorded origin 53 times on 1 November, against 8–15 a day on 25–30 October. A callsign is a flight number, not a specific aircraft, and this is a continuity indicator, not a flight log — but it is what lost reception looks like, and not what cancellations look like.
It began a day earlier, on the departure side. 31 October was already incomplete. Arrivals ran close to normal (96 against 95–121 on 25–30 October), but departures were recorded 65 times against 133–159, and callsigns that usually depart Ahmedabad turned up with no recorded origin 62 times, against 8–15. A receiver that hears aircraft on approach but loses them on the ground and in the first minutes of climb would produce exactly that. On 1 November the loss became total from 08:00 UTC. We cannot see the receivers themselves, so this is an inference from the pattern of records, not a confirmed equipment fault.
The second network lost the area too. We cross-check against a second crowdsourced ADS-B aggregate built on volunteer receivers. It does not report movements for Ahmedabad at all, so it cannot confirm or contradict the count directly, but its count of aircraft seen per one-degree cell is telling: the cell covering the Ahmedabad–Vadodara area fell from 141–152 aircraft a day on 29–31 October to 3 on 1 November, and the cells to its south roughly halved. Its movement count for Vadodara, 102 km away, went from 8–23 a day to no record. Two networks losing the same area on the same day points at shared receivers going offline, not at the sky emptying — some volunteer receivers feed more than one network. Mumbai, 444 km south, is in a separate partial coverage gap of its own since 25 October, with evening records back on 1 November.
No weather, no closure, no interference. Ahmedabad’s routine weather reports on 31 October – 2 November show haze, mist and smoke with visibility of 2,000–6,000 m, no cloud ceiling and winds of 0–11 kt; none of the 140 reports carried thunderstorm, fog or heavy rain. No closure signal registered in the Mumbai FIR (VABF) for these days — a FIR-level statement about airspace signals, not a claim about operations at Ahmedabad, which belong to the airport, the airlines and Indian aviation authorities. Two older low-confidence (0.18) VABF flags of unknown cause, spanning 15–22 and 25–28 October, are tied to the Mumbai gap, not to Ahmedabad. Our NOTAM set, last refreshed on 1 November at 05:01 UTC, holds 23 VABF notices; the two that name Ahmedabad concern radio-telephony procedure and a departure route into the Mumbai terminal area, and none closes the airport. The airport’s seven-day GNSS-interference ratio is near zero.
What would change this page. Two things decide it. The records coming back: if Ahmedabad reappears in our feed at its pre-gap hourly rate, as Mumbai did in October, this closes as a coverage gap once the first complete day reads near ~258; if records come back at a markedly lower rate, the reading would change and we would say so. An official signal: a closure, a NOTAM or an operational notice for AMD appearing in any layer would change the framing. Until then we publish measured signals and their limits, not a traffic figure we do not have.
Passenger questions, answered from the data
Nothing in the layers we track points to a closure. No closure signal registered in the Mumbai FIR (VABF), no notice in our NOTAM set closes the airport, and flights bound for Ahmedabad kept departing Delhi, Bengaluru, Mumbai and other origins at their usual rate. The −72% reading comes from our own receivers losing Ahmedabad from 08:00 UTC. For official status, check the airport or your airline.
The observed count did — 71 movements on 1 November against ~258 a day on 25–30 October — but all 71 fall before 08:00 UTC, and after that our feed recorded nothing at the airport. Observed counts are a floor, not a total, and on this day the floor is not informative: flights that normally land at Ahmedabad kept departing their origins, but their landings were not recorded, and a second receiver network lost the area too. We do not know how many flights operated, and we do not claim a fall.
Crowdsourced flight tracking depends on volunteer ground receivers near each airport. The pattern we see — departure records thinning on 31 October, then every record stopping at 08:00 UTC on 1 November, with a second network losing the same area the same day — is consistent with receivers in the Ahmedabad area going offline. We cannot see the receivers themselves, so the cause of the outage is not known to us.
We publish measured signals, not safety verdicts — operating decisions belong to airlines, the airport and Indian aviation authorities, who work from complete operational data rather than crowdsourced tracking. What we can say: the gap is in our measurement, weather at the airport was routine haze and mist, and no closure signal registered in the Mumbai FIR. For any specific flight, check your airline on the day of travel.
For media — the full kit
Everything on this page — charts, CSV, quotes — is published under CC BY 4.0: free to reuse with attribution to FlySafe.zone. Charts come in dark (social/web) and light (print/light layouts) versions; attribution and license are embedded in every file.
“Observed traffic at Ahmedabad’s Sardar Vallabh Patel International Airport read 72% below normal on 1 November, but the figure reflects a gap in crowdsourced tracking rather than fewer flights: every recorded movement fell before 08:00 UTC, flights bound for Ahmedabad kept departing Delhi, Bengaluru and Mumbai at their usual rate with their landings unrecorded, and a second receiver network lost the same area the same day, according to flight-monitoring service FlySafe.zone.”
Boilerplate — about the source (for your article footer)
FlySafe.zone monitors airspace risk and observed airport activity worldwide: 334 flight-information regions scored daily, GPS-interference signals, volcanic-ash exposure and daily observed movements at 493 airports from the crowdsourced ADS-B receiver network. Methodology: flysafe.zone/methodology.
Need a different cut of the data, a comment, or numbers for another airport? Leave an email — we answer fast during active events.