Perth (PER) Traffic ‘Drop’ of −61% on Saturday 21 November 2026 — a Saturday Trough on a Provisional Count
- Nothing in the layers we track points to a disruption at Perth. The −61% ‘drop’ on Saturday 21 November compares a Saturday with a weekday-heavy weekly average — Perth runs ~665–765 observed movements on a midweek day and ~190–230 on a Saturday.
- Against other Saturdays the first read of 166 is −16% and below the 188–237 band of the last twenty — but it is provisional: arrivals are already normal and departures typically keep arriving in our feed for two to three days. We will update when it settles (25 Nov).
- This is the third time a Perth Saturday has tripped the detector (August and October before it); both earlier flags closed with no disruption found.
Advisory timeline — how active is this episode
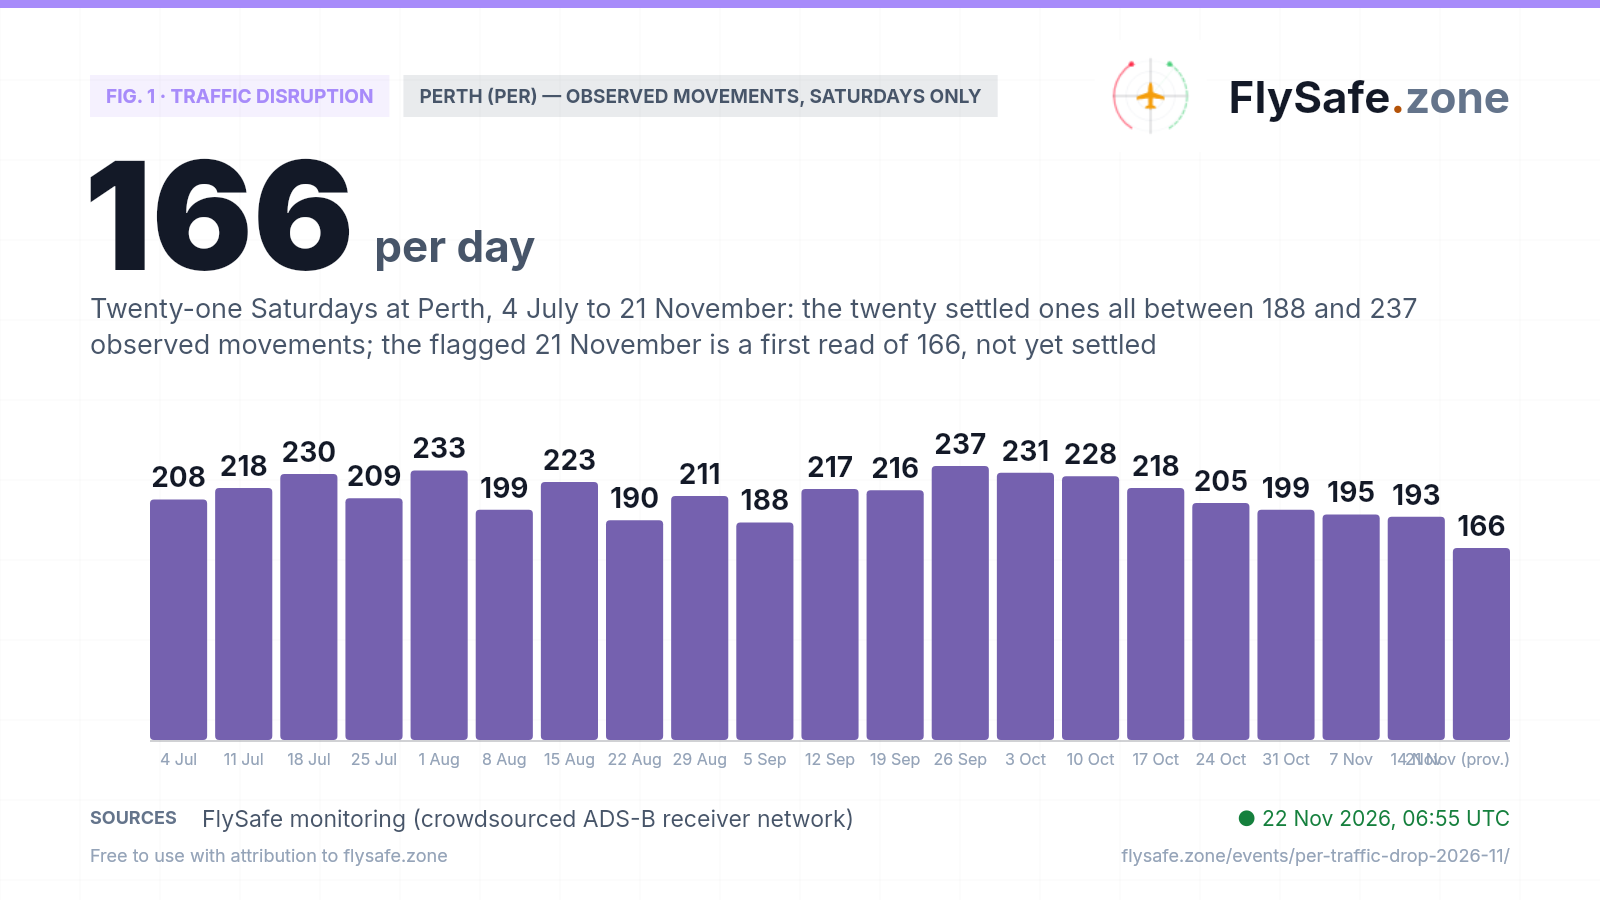
The honest baseline for a Saturday at Perth is other Saturdays at Perth. Across the twenty settled Saturdays from 4 July to 14 November the network observed between 188 and 237 movements, averaging 212; the last eight have drifted gently down from 237 (26 Sep) to 193 (14 Nov). The flagged day, Saturday 21 November, is a first read of 166 — below that band, but on a day whose departures are still landing in the feed. Earlier Saturdays rose between first read and settled count (10 Oct 215 → 228, 17 Oct 207 → 218, 24 Oct 200 → 205). Observed movements per Saturday:
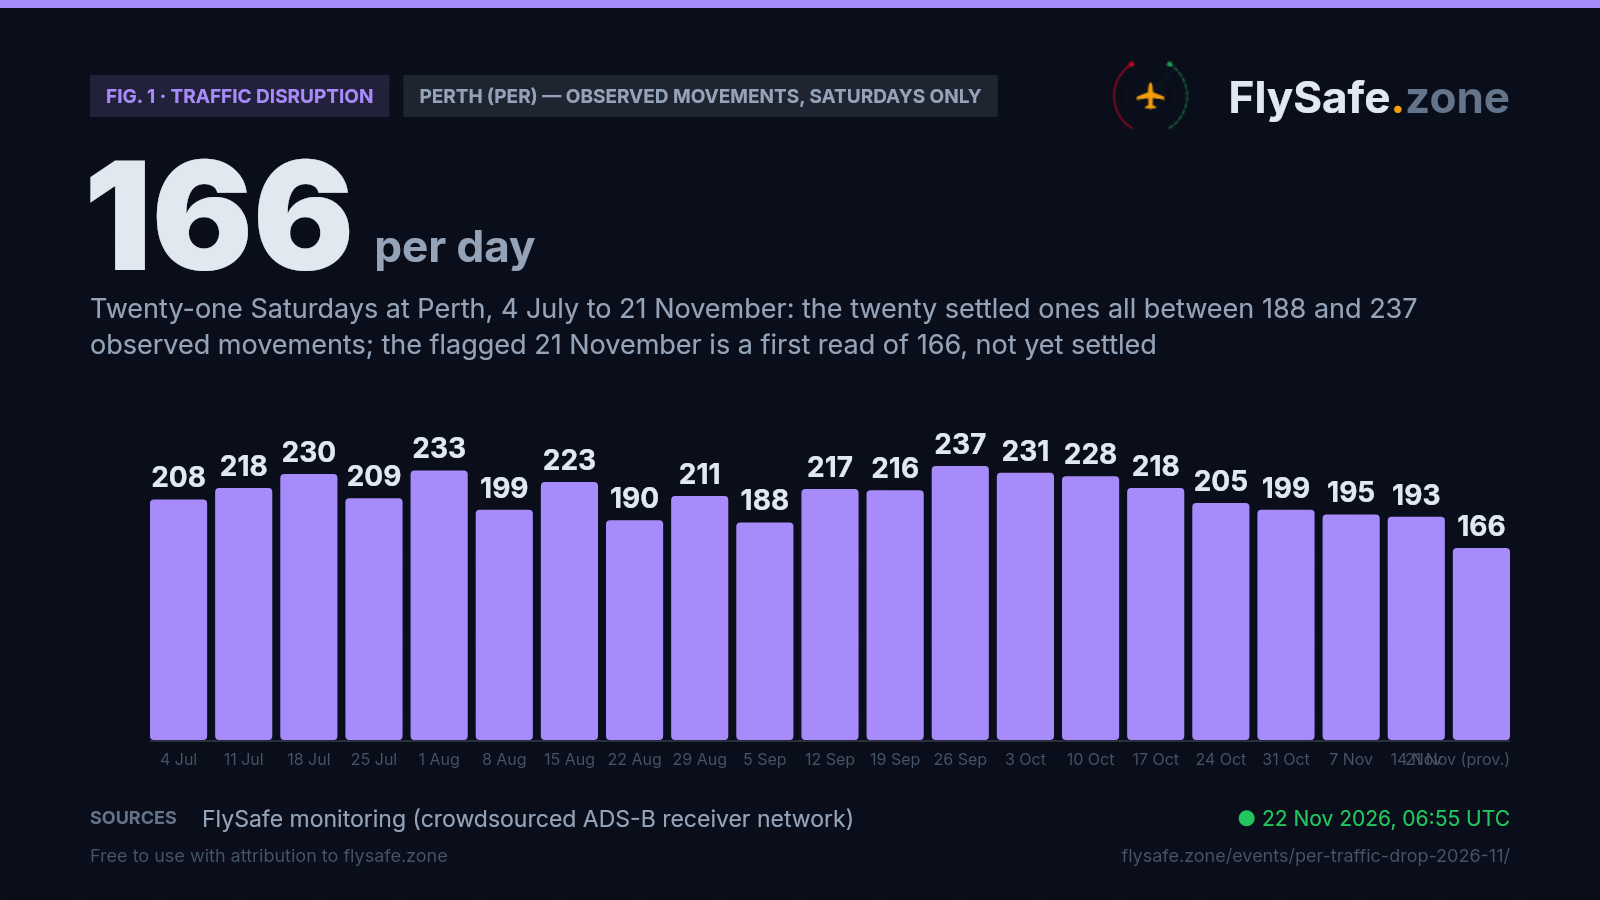
Fig. 1 — Observed movements at Perth International (PER) on each Saturday (UTC day), 4 Jul – 21 Nov 2026; 4 Jul – 14 Nov settled on their nightly refetches; 21 Nov is the provisional first read of 22 Nov 06:25 UTC and will change · Data as of 22 Nov 2026, 06:55 UTC · Source: FlySafe monitoring (crowdsourced ADS-B receiver network).
Airports in the exposure zone
| Airport | Size | Observed signal | FIR |
|---|---|---|---|
| Perth International (PER) | large | — · Sat 21 Nov, provisional: 166 observed (74 dep / 92 arr) vs ~198 four-Saturday baseline (−16%) · −17% vs the 199 same-weekday detector baseline · 20 settled Saturdays since 4 Jul: avg 212, band 188–237 · settles 25 Nov | YMMM |
Distance alone does not determine impact — wind direction and the flight levels the ash reaches decide which airports and routes are affected on a given day. FIR = Flight Information Region.
What our monitoring shows: Perth’s weekly saw-tooth, with the flagged Saturday still on a first read
FlySafe tracks observed departures and arrivals at 493 airports from crowdsourced ADS-B receiver data. Observed counts are a floor, not a total — receiver coverage varies — but an airport measured against its own baseline is a reliable shape. Perth International's last 30 days:
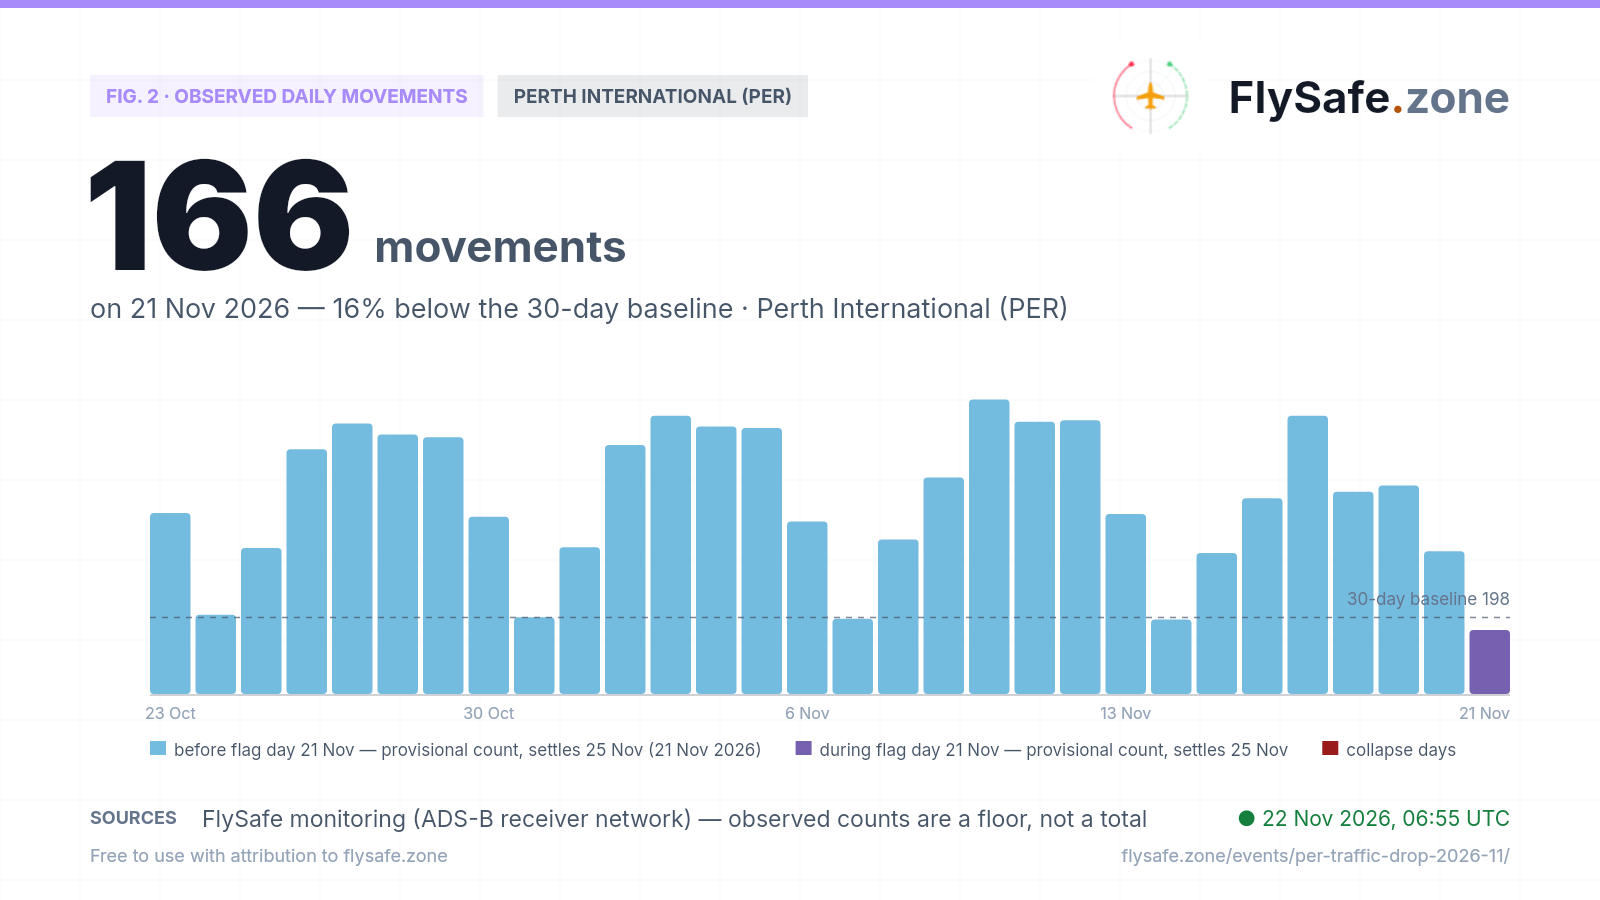
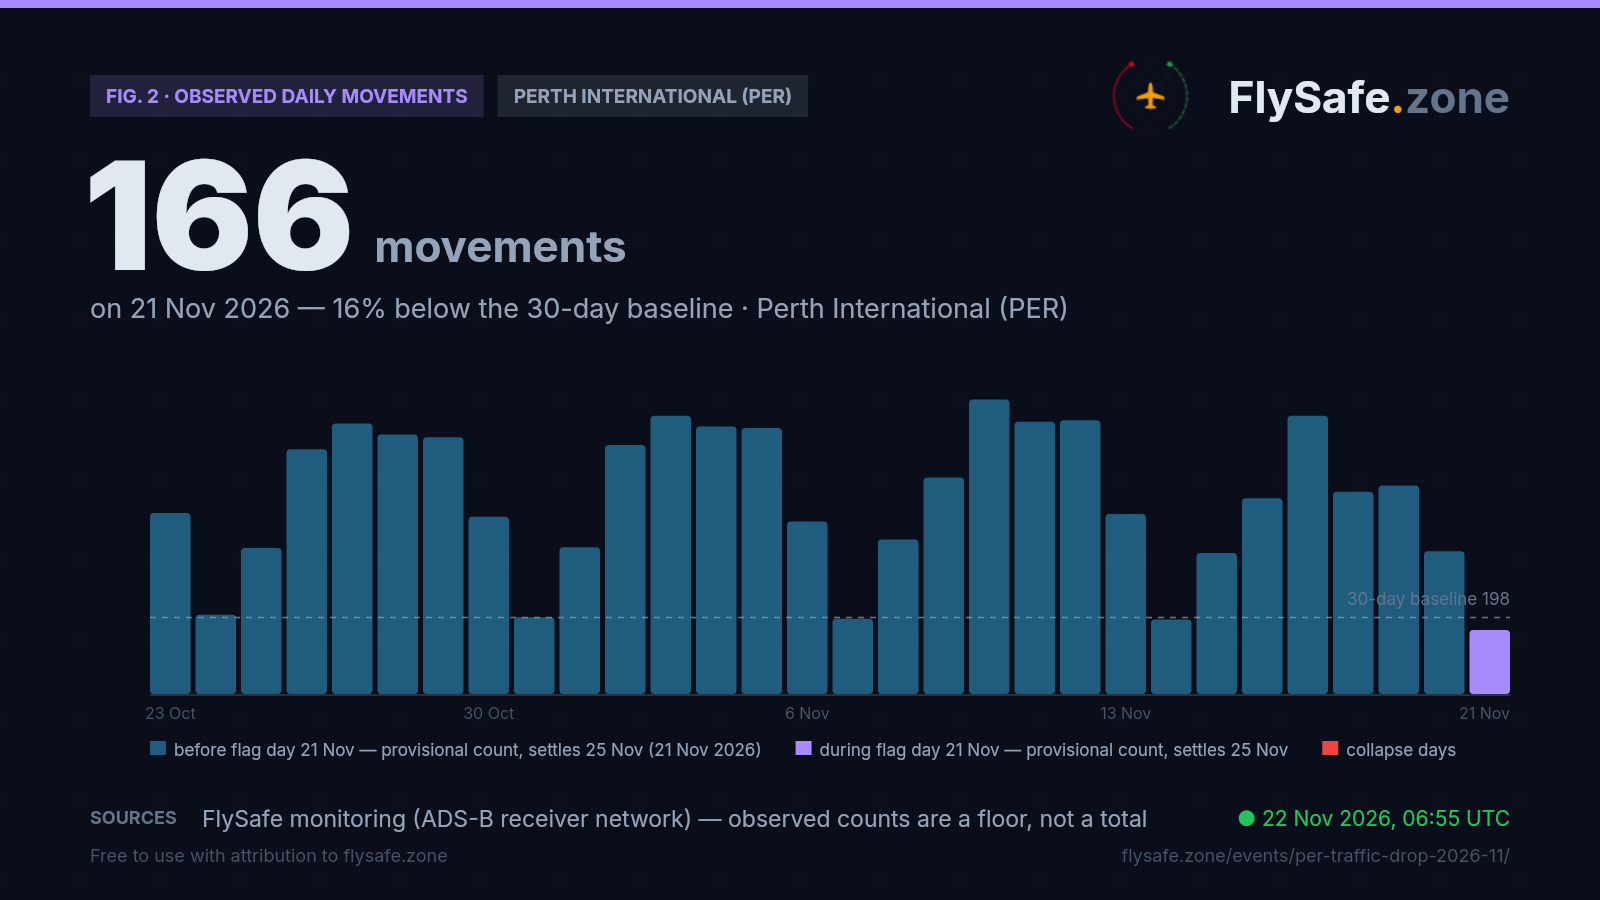
Fig. 2 — Observed daily movements at PER, 23 Oct – 21 Nov (latest complete UTC day). Data as of 22 Nov 2026, 06:55 UTC · Source: FlySafe monitoring (ADS-B receiver network).
- The weekly shape: Tuesdays to Thursdays mostly 665–765 observed movements, Fridays stepping down to ~450–470, Saturdays 193–205, Sundays ~365–400. A seven-day average sits near ~530 in a normal week, so any Saturday reads roughly −60% against it.
- Baseline for this chart: 198 = mean of the four Saturdays before the flag (24 Oct 205, 31 Oct 199, 7 Nov 195, 14 Nov 193).
- Sat 21 Nov, provisional: 166 (74 departures / 92 arrivals) — −16% vs that baseline. Arrivals are already level with recent Saturdays (14 Nov 90, 7 Nov 94); departures are short of their usual ~100–108, and departures are the side that reaches our feed last. Hour by hour, 21 November’s departures track 14 November’s profile slightly lower throughout — no gap, no stop. The independent ADS-B aggregate has not yet published 21 November.
- Provisional days on this page: 19, 20 and 21 November are not settled. 19 November is plotted at its full recount of 540 (260 / 280); the stored daily row reads 332 because the latest three-hourly refresh clips days older than three days.
- Feed divergence flagged on this page: settled Monday 16 Nov (507) and Wednesday 18 Nov (524) sit below their usual levels, with departures (259 and 252) the short side — while the independent ADS-B aggregate counted those days at 545 and 590, level with the weeks before (9 Nov 542, 11 Nov 573). We read that as a coverage dip in our receiver feed, not as fewer flights, and do not count it as disruption.
Live view: PER airport brief. Previous Perth Saturday flags, both closed with no disruption found: August and October.
What it means for flights
What fired, and why we are publishing it. Our detection layer flagged PER when the 21 November observed count came in at −61% against Perth’s ~426 seven-day rolling average — a large number at Western Australia’s principal airport. Automated multi-signal analysis then cross-checked it against the other layers we track: closure signals, weather-reporting continuity, volcanic-ash exposure, the composition of the count, and the airport’s same-weekday history. None of them corroborates a disruption. We publish the check because a bare −61% is exactly the kind of figure that gets repeated without its baseline.
Why Saturday always looks like a crash at Perth. Perth’s observed traffic has one of the deepest weekly rhythms we measure: a midweek day runs 665–765 observed movements, a Saturday 188–237. A large share of the weekday traffic is regional and resource-sector flying that thins sharply at weekends. Against a rolling seven-day average, every Saturday therefore reads around −60%. The honest comparison is same-weekday — which is what the Saturday chart above shows and what our own airport detector uses (−17% vs 199, rated normal).
Why this one is still amber. The first read of 166 sits below every settled Saturday since July, and earlier first reads rose by 5 to 13 movements before settling — not enough, on that history, to reach the band. The split matters: arrivals (92) are already level with 14 November (90) and 7 November (94), while departures (74) are short of the usual ~100–108. Departures are the side that reaches our feed last, and our receiver feed has also under-counted Perth departures on two settled weekdays this week (16 and 18 Nov) while an independent ADS-B aggregate counted normal traffic. So the open question is coverage versus schedule, and the settled count plus the independent aggregate will answer it.
What the other layers say. Closures: no closure event for Perth or the Melbourne FIR (YMMM) in the last 30 days. Weather: the Perth station filed 49 METARs on 21 November, normal cadence, none IFR; showers and gusts up to 33 kt were reported, comparable to 15 November. Ash: no exposure. Hourly shape: departures on 21 November follow the 14 November profile slightly lower in most hours — the signature of a thinner count, not of a stoppage. These are FIR- and station-level signals, labelled as such; the operating decision on any given day stays with the airport, the airline and the relevant authorities.
Passenger questions, answered from the data
No signal in the layers we track indicates a disruption: no closure event for Perth or its FIR, the weather station reporting on its normal cadence with no IFR observation, and no ash exposure. The −61% figure comes from comparing a Saturday against a weekday-heavy seven-day average. Against other Saturdays the provisional count is −16% and still settling — the PER brief updates nightly. Check your airline’s status on the day of travel.
Perth’s weekday schedule carries a lot of regional and resource-sector flying that thins sharply at weekends. Our network observes ~665–765 movements on a midweek day and ~190–230 on a Saturday, so any Saturday reads around −60% against a rolling weekly average. Same-weekday comparison removes that effect.
We do not issue safe/unsafe verdicts. We publish the measured operational picture — here, a Saturday traffic count still settling and no closure, ash or low-visibility signal. Go/no-go decisions belong to airlines, the airport and Australian authorities.
For media — the full kit
Everything on this page — charts, CSV, quotes — is published under CC BY 4.0: free to reuse with attribution to FlySafe.zone. Charts come in dark (social/web) and light (print/light layouts) versions; attribution and license are embedded in every file.
“Observed traffic at Perth International read 166 movements on Saturday 21 November on a provisional count — flagged as a −61% anomaly against the airport’s seven-day rolling average — but against its own Saturdays the day reads −16%: the four Saturdays before it averaged 198, arrivals were already at their usual level and departures were still arriving in the feed, according to flight-monitoring service FlySafe.zone, which found no corroborating closure, weather or ash signal and will update when the count settles.”
Boilerplate — about the source (for your article footer)
FlySafe.zone monitors airspace risk and observed airport activity worldwide: 334 flight-information regions scored daily, GPS-interference signals, volcanic-ash exposure and daily observed movements at 493 airports from the crowdsourced ADS-B receiver network. Methodology: flysafe.zone/methodology.
Need a different cut of the data, a comment, or numbers for another airport? Leave an email — we answer fast during active events.