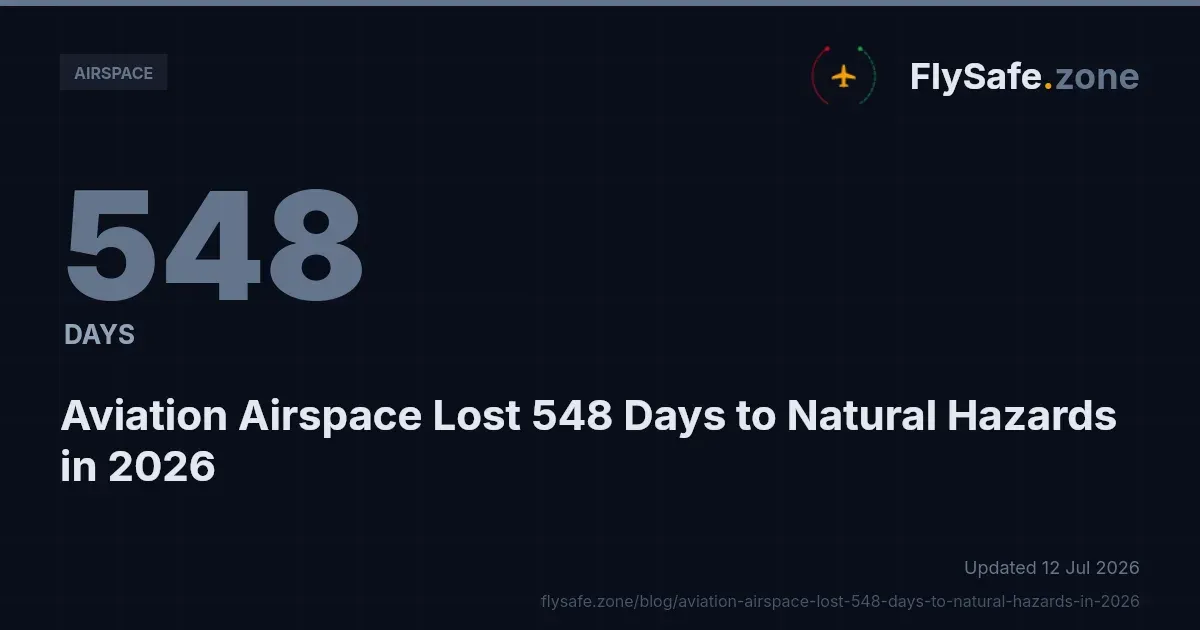
Natural hazards — volcanic ash, seismic activity and tropical cyclones — accounted for 548 airspace-days of confirmed aviation airspace disruption in the first half of 2026, roughly 38 percent of all disruption recorded worldwide. The figure comes from FlySafe airspace-risk collectors covering 2026-01-01 through 2026-07-12, a period in which 265 confirmed disruption events were recorded across 59 flight information regions (FIRs), totalling 1,425 airspace-days. While conflict-zone restrictions remain the single largest cause category, the natural-hazard share is substantial — and, as the data shows, it is systematically under-represented in NOTAM-only monitoring.
This bulletin summarises the natural-hazard component of the 2026 dataset: which FIRs were affected, how long disruptions lasted, and how these events are detected and corroborated. Analysis is based on publicly available data only.
The 2026 Cause Mix: Where Natural Hazards Sit
Across the full January–July window, confirmed disruption events break down by cause category as follows (FlySafe data, as of 2026-07-12, measured in airspace-days):
| Cause category | Airspace-days | Share | Events |
|---|---|---|---|
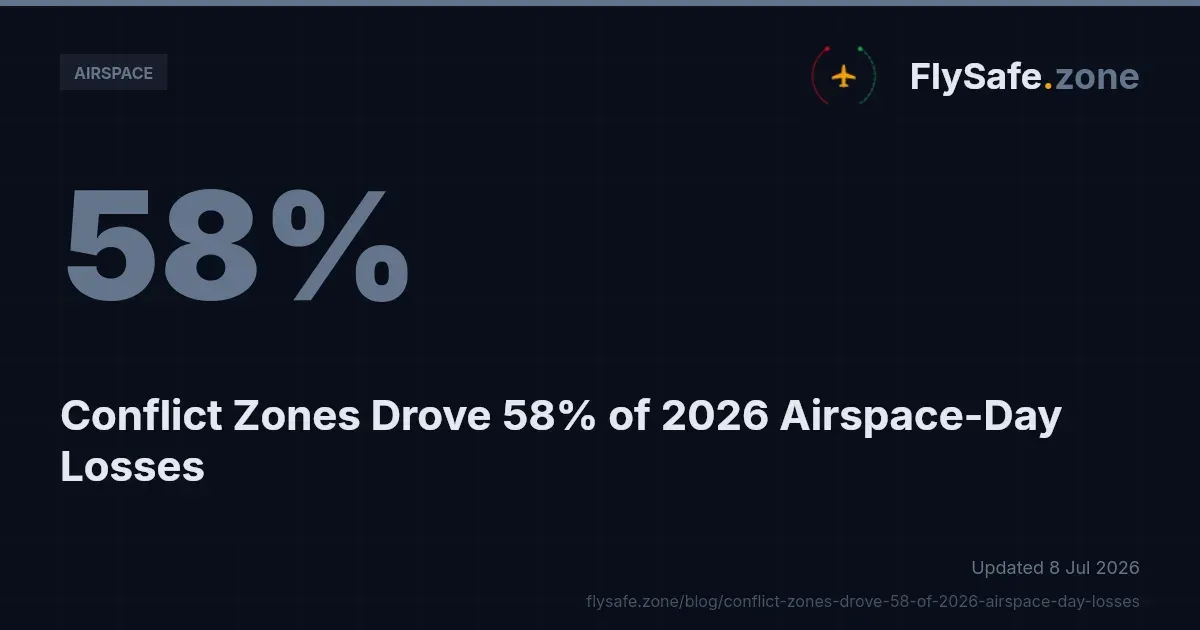
| Conflict-zone restrictions | 780 | 55% | 143 |
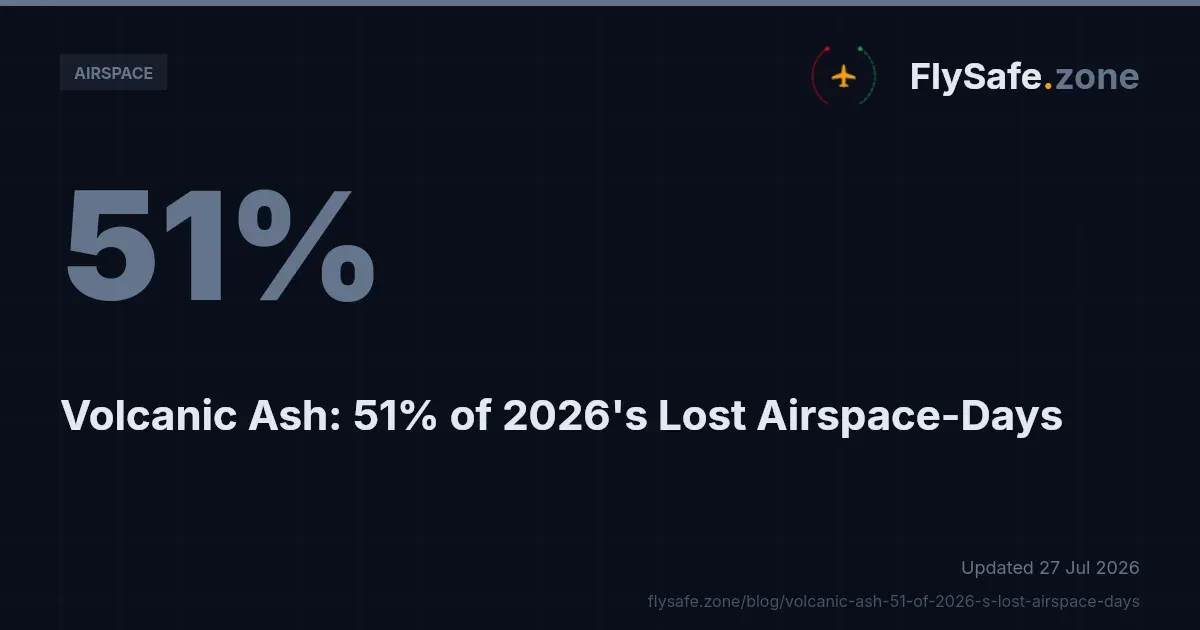
| Volcanic ash | 339 | 24% | 45 |
| Seismic activity | 198 | 14% | 26 |
| Other regulatory restrictions | 97 | 7% | 46 |
| Tropical cyclones | 11 | 1% | 5 |
The three natural-hazard categories combined — 548 airspace-days across 76 events — exceed two-thirds of the conflict-zone total. For flight-planning departments, this matters: conflict-zone restrictions tend to be well-publicised and long-anticipated, while volcanic ash and seismic disruptions arrive with little warning and frequently affect routes with no prior risk profile.
All 265 confirmed disruptions in the dataset had ended by the as-of date, with 125 ending in the last 30 days. The average confirmed disruption ran approximately 5.4 airspace-days — long enough to force multi-day rerouting and fuel-planning adjustments, short enough that static route policies routinely lag the actual airspace status.
Volcanic Ash: 339 Airspace-Days, Concentrated in Three FIRs
Volcanic ash was the largest natural-hazard category in 2026, with 45 confirmed events producing 339 airspace-days of disruption. The most affected FIRs by airspace-days:
- RPHI — 167.0 airspace-days
- BIRD — 44.0 airspace-days
- PAZA — 25.0 airspace-days
RPHI stands out not only for volume but for its detection signature. Its 13 confirmed events were corroborated by NOTAM in 85 percent of cases — but by flight-traffic data in 0 percent. In other words, ash-related restrictions in this FIR were formally published, yet produced no traffic deviation detectable in ADS-B surveillance during the confirmed windows. The inverse pattern — heavy traffic corroboration with sparse NOTAM coverage — dominates elsewhere in the dataset. The practical implication is that no single signal type reliably covers volcanic-ash disruption: advisory-driven events may show clean paperwork with little observable traffic impact, and the reverse also occurs.
Ash events enter the FlySafe consensus engine through public volcanic-ash advisories — the products issued by Volcanic Ash Advisory Centres — which are then matched against NOTAM issuance and FlySafe's own ADS-B flight-traffic collection. An event is confirmed only when at least two independent signals agree.
Seismic Activity: 198 Airspace-Days, One Dominant FIR
Seismic activity produced 26 confirmed events and 198 airspace-days in the window. The distribution is heavily skewed:
- MMFR — 165.0 airspace-days
- RJDG — 11.0 airspace-days
- RJTG — 9.0 airspace-days
MMFR alone accounts for more than 80 percent of all seismic airspace-days in 2026. Its 12 confirmed events show the strongest corroboration profile in the entire dataset: 100 percent confirmed by flight-traffic data and 92 percent by NOTAM. Where seismic events affect airspace, the effect is visible both on paper and in the traffic picture — a contrast with the volcanic-ash pattern described above.
Seismic detection inputs are public seismic advisories, cross-referenced against FIR geometry and corroborated by observed traffic behaviour. The dataset does not include cost estimates or carrier-level impact figures for these events; that data is not currently available.
Tropical Cyclones: Small in Days, Real in Planning Impact
Tropical cyclones were the smallest confirmed category: 5 events and 11 airspace-days, concentrated in ZSHA (4.0 airspace-days), ZJSA (4.0 airspace-days) and RCAA (3.0 airspace-days). Cyclone-driven disruptions in the dataset were short — consistent with the transient nature of storm tracks — but clustered in high-density Asia-Pacific airspace where even brief restrictions propagate delay across regional networks.
Cyclone events are detected from public storm-track advisories and corroborated by ADS-B traffic data; severe-weather conditions of this scope are the domain of SIGMET advisories issued by Meteorological Watch Offices, which remain the operational reference for crews in the affected regions.
The Signal Gap: Why NOTAM-Only Monitoring Misses Most Disruptions
Across FIRs with three or more confirmed events, flight-traffic data corroborated approximately 73 percent of events, while NOTAMs corroborated only about 29 percent. A monitoring posture built solely on NOTAM review would therefore miss the majority of confirmed disruptions in the 2026 dataset.
The natural-hazard categories illustrate both ends of this gap. RPHI's ash events were NOTAM-rich and traffic-silent; MMFR's seismic events were near-fully visible in both channels. Elsewhere — including the most disrupted FIRs overall, where NOTAM corroboration ran as low as 37–46 percent — published notices materially lagged or under-covered what surveillance data showed. Flight-planning teams relying exclusively on NOTAM feeds should treat that channel as necessary but not sufficient.
Recommendation: operators should combine formal aeronautical information (NOTAM, AIP, advisories) with independent traffic-behaviour monitoring when assessing airspace availability, particularly for ash- and seismic-prone FIRs where the two channels demonstrably diverge.
Monthly Trend: A Sharp Mid-Year Concentration
Confirmed events by month in 2026: January 5, February 16, March 1, April 21, May 72, June 130, July 20 (partial month, through July 12). The May–June concentration — 202 of 265 events — reflects the full cause mix, including the conflict-zone category; the dataset does not provide a monthly breakdown by cause, so no month-level attribution to natural hazards is made here.
Regulatory Context
Several frameworks govern how the disruptions in this dataset are published and managed:
- ICAO Annex 11 (Air Traffic Services) defines FIR structure and the responsibility of states to provide air traffic services within their regions — the geometry against which all airspace-day figures above are measured.
- ICAO Annex 15 (Aeronautical Information Services) governs the NOTAM system through which temporary restrictions, including ash- and seismic-related ones, are formally promulgated. The signal-gap findings above are, in effect, a measurement of how completely this channel captures real-world disruption.
- ICAO Doc 4444 (PANS-ATM) sets the air traffic management procedures applied when traffic is rerouted around affected volumes.
- EU Regulation 965/2012 (Air Operations) obliges European operators to account for airspace status and hazards in operational control and flight planning.
- EASA Conflict Zone Information Bulletins (CZIBs) are the advisory instrument for the conflict-zone category that makes up the remaining 55 percent of 2026 airspace-days; where a CZIB exists without a state-level restriction, the correct status is advisory only, not closed. Current bulletins are published on the EASA CZIB page.
- 14 CFR Part 91 (FAA) and the FAA Aeronautical Information Manual govern US operator obligations, including compliance with temporary flight restrictions that feed the "other regulatory restrictions" category (led in 2026 by KZLC, KZMP and KZJX at 10.0 airspace-days each).
Methodology & Provenance
- Source: FlySafe airspace-risk collectors; window 2026-01-01 to 2026-07-12; data as of 2026-07-12.
- Confirmation standard: the FlySafe consensus engine requires at least two independent signals per event plus an attributed cause. Detections with undetermined cause are excluded from all figures above.
- Inputs: public NOTAM data, EASA publications, FAA temporary flight restrictions, volcanic-ash advisories, seismic advisories, and FlySafe's own ADS-B flight-traffic collection, which serves as the primary corroborating signal.
- Units: one airspace-day equals one FIR affected for one day; concurrent events in different FIRs accumulate separately.
- Known gaps: the dataset does not include cost figures, carrier-specific impacts, or individual NOTAM references, and none are cited here.
FlySafe is not an operational authority. This bulletin is analytical material and does not replace official aeronautical information. Operators must rely on current NOTAMs, AIP entries, SIGMETs and state CAA publications for flight-planning decisions.
Key Takeaway
Natural hazards produced 548 of the 1,425 confirmed airspace-days of disruption recorded across 59 FIRs in 2026 to date — a share large enough to warrant dedicated monitoring, yet one that NOTAM-only review demonstrably under-captures. The corroboration asymmetry between RPHI (85 percent NOTAM, 0 percent traffic) and MMFR (92 percent NOTAM, 100 percent traffic) shows why multi-signal confirmation is not a refinement but a requirement.
FlySafe analysis of confirmed airspace disruptions, updated continuously from publicly available advisories and independent ADS-B surveillance, is available for operators and analysts who need airspace status grounded in evidence rather than a single reporting channel. Analysis based on publicly available data only.
- Natural hazards (volcanic ash, seismic, tropical cyclones) account for 38% of all confirmed aviation airspace disruption in H1 2026 — 548 out of 1,425 airspace-days — a share that exceeds two-thirds of the conflict-zone total, yet these events arrive with far less advance warning than conflict-zone restrictions.
- Volcanic ash disruption is heavily concentrated geographically: one FIR (RPHI) alone produced 167 of the 339 total ash airspace-days, meaning exposure is not evenly distributed and route-level risk profiling matters more than fleet-wide averages.
- The RPHI case reveals a detection paradox: ash restrictions there carried 85% NOTAM coverage but 0% ADS-B traffic-deviation corroboration, while the inverse pattern dominates elsewhere — confirming that neither signal type alone is sufficient and multi-source corroboration is required.
- The average confirmed disruption lasted approximately 5.4 airspace-days — long enough to force multi-day rerouting and fuel adjustments, yet short enough that static route policies routinely lag actual airspace status.
Powered by B1KEY
Live tools behind the analysis.
The signals FlySafe writes about are also published live — continuously verified by the Sentinel pipeline.
Information is accurate as of the publication date. FlySafe uses exclusively publicly available data.