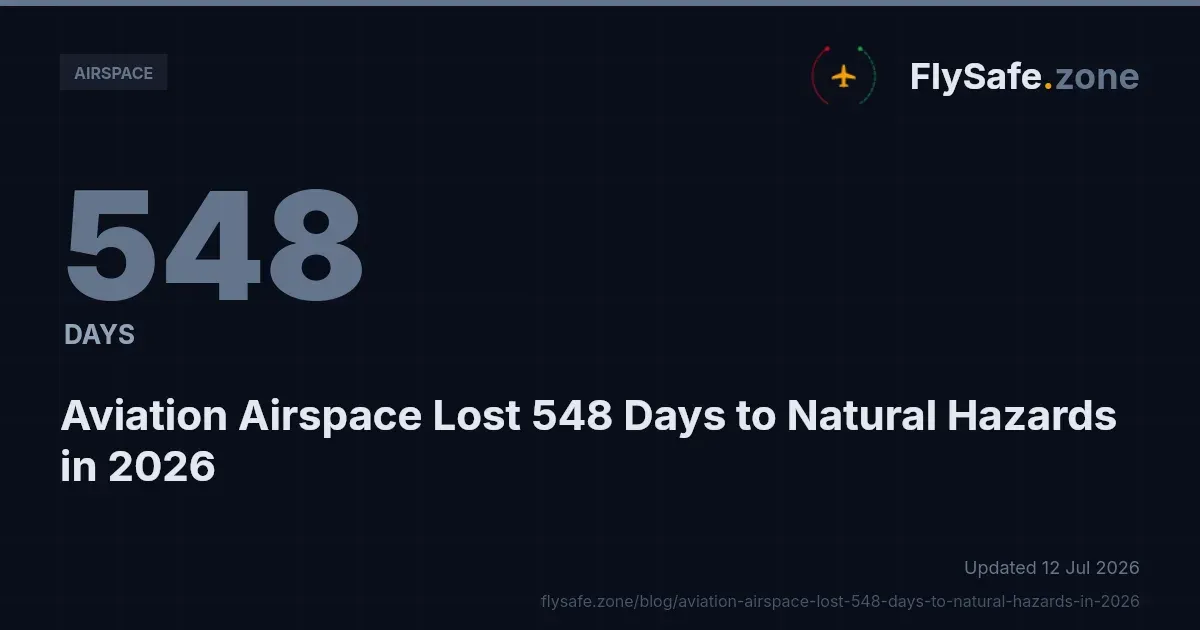
Between 1 January and 5 July 2026, FlySafe airspace-risk collectors recorded 227 confirmed airspace-disruption events spanning 56 flight information regions (FIRs), together accounting for 1,028 airspace-days. FlySafe analysis shows that these disruptions did not arrive evenly, nor from a single cause. Sorting them into neutral operational categories reveals which factors actually removed the most airspace from civil use — and where the standard notice channels failed to capture what happened. This bulletin breaks 2026 down by disruption category, ranked by the metric that matters most to route planners: airspace-days.
All figures below are drawn from the FlySafe consensus engine and are current as of 5 July 2026. Only confirmed events are counted — those corroborated by at least two independent signals and carrying an attributed cause. Detections with an undetermined cause are excluded.
The Cause-Category Mix by Airspace-Days
Airspace-days — the number of days a given volume was affected — is a more useful denominator than raw event counts, because a single long-running restriction can outweigh many short ones. Measured this way, the 2026 mix breaks down as follows:
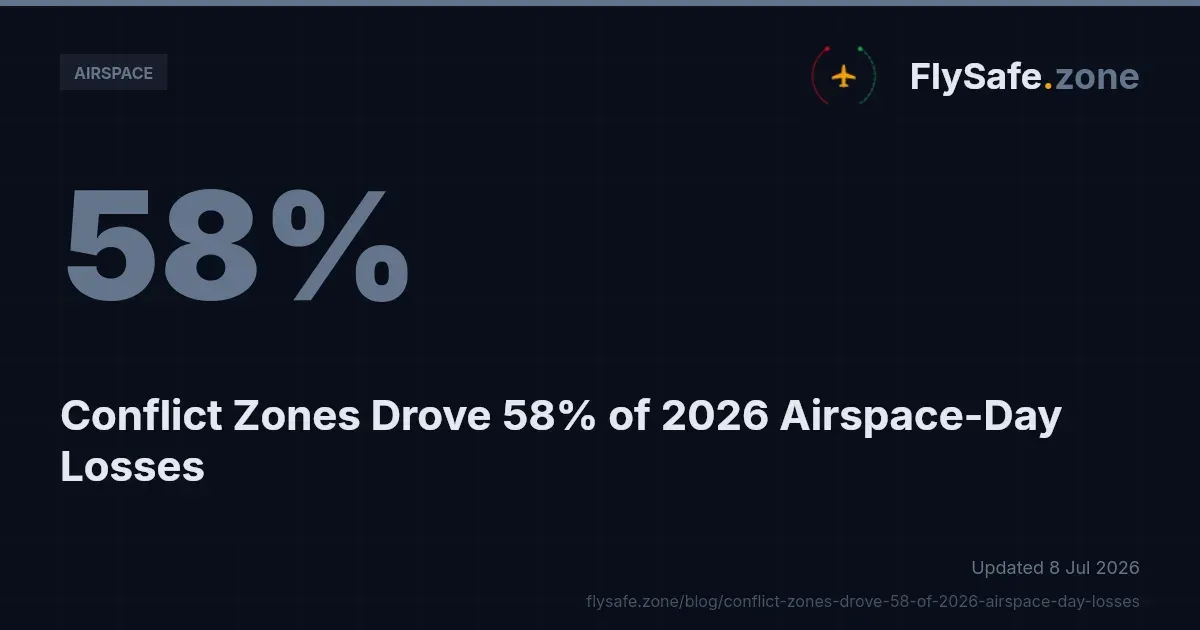
- Conflict-zone restrictions: 58% — 594 airspace-days across 126 events.
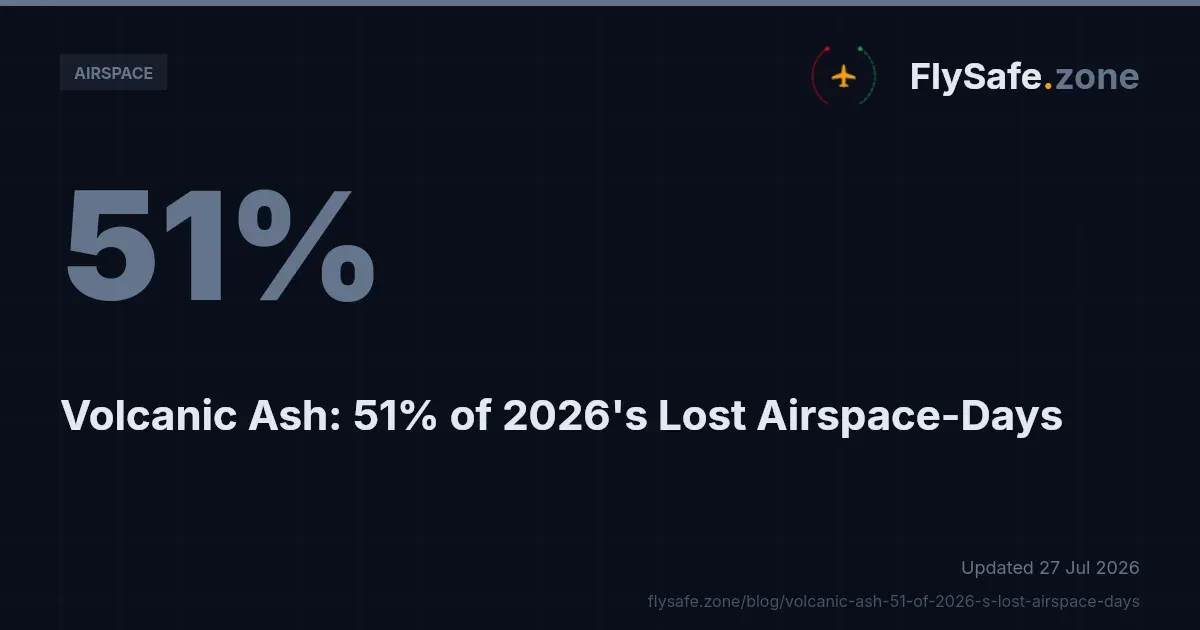
- Volcanic ash: 21% — 216 airspace-days across 37 events.
- Seismic activity: 11% — 117 airspace-days across 16 events.
- Other regulatory restrictions: 9% — 97 airspace-days across 46 events.
- Tropical cyclones: under 1% — 4 airspace-days across 2 events.
Two observations follow directly from the data. First, conflict-zone restrictions dominate both dimensions: they account for the most airspace-days and the most events, and they are the single largest planning consideration for any operator routing through affected regions. The operational and rerouting consequences of that concentration are examined in FlySafe's review of how Middle East airspace closures reshaped global flight routes in 2026.
Second, natural-hazard categories are not marginal. Volcanic ash and seismic activity together contributed 333 airspace-days — roughly a third of the total — across 53 events. Ash in particular is a hard operational constraint rather than an advisory: engine-ingestion risk means affected volumes are typically avoided outright, regardless of the security picture elsewhere.
Most-Affected FIRs Within the Categories
The disruption did not spread uniformly across the 56 FIRs. A small number carried a disproportionate share of the total airspace-days.
- Tehran FIR (OIIX): 36 events, 249.0 airspace-days — the single most disrupted region in the dataset.
- Damascus FIR (OSTT): 27 events, 151.0 airspace-days.
- RPHI: 10 events, 111.0 airspace-days.
- Tel Aviv FIR (LLLL): 23 events, 101.0 airspace-days.
- MMFR: 7 events, 91.0 airspace-days.
- UUWV: 9 events, 32.0 airspace-days.
The FIRs concentrated in and around the Eastern Mediterranean and the Gulf reflect the conflict-zone category's weight in the overall mix. Operators planning transits through these regions face the largest cumulative exposure; FlySafe's dedicated analysis of Iran airspace restrictions and their effect on global routing in 2026 covers the OIIX picture in more depth. RPHI and MMFR, by contrast, carry high airspace-day totals from comparatively few events — a signature of long-duration natural-hazard or structural restrictions rather than a high frequency of short closures.
Affected routes: where a primary FIR is unavailable, traffic redistributes onto adjacent corridors, and those corridors absorb the additional load. FlySafe's account of how the Caucasus air corridor absorbed rerouted traffic illustrates the downstream congestion effect that follows a major regional restriction.
The Trend Through the Year
Confirmed events were not evenly distributed month to month. The 2026 monthly count ran: January 5, February 16, March 1, April 21, May 72, June 98, and July 14 (partial month, through 5 July). The concentration in May and June is the defining feature of the period. Recovery has kept pace: 215 of the 227 confirmed disruptions have already ended, 89 of them within the last 30 days, and the average confirmed disruption ran approximately 4.5 airspace-days. In other words, most events are relatively short-lived, but the sheer volume during the peak months produced the bulk of the cumulative airspace-day total.
Why NOTAM-Only Monitoring Misses the Majority
The most operationally significant finding in the 2026 data is a detection gap. Across FIRs with three or more events, FlySafe's own ADS-B flight-traffic collection corroborated roughly 75% of confirmed events, while NOTAMs corroborated only about 22%. The pattern holds at the level of individual FIRs:
- Tel Aviv FIR (LLLL): flight-traffic corroborated 96% of events; NOTAM, 26%.
- Tehran FIR (OIIX): flight-traffic 92%; NOTAM 39%.
- Damascus FIR (OSTT): flight-traffic 70%; NOTAM 26%.
The implication is direct: a monitoring process that relies on published notices alone would have missed the majority of confirmed disruptions in these regions. Observed traffic behaviour — aircraft rerouting, gaps opening in normally busy corridors — frequently registered a disruption before, or in the absence of, a corresponding NOTAM. This is precisely why FlySafe requires at least two independent signals per event and treats ADS-B as the primary corroborating layer rather than a supplement.
One exception is worth noting for balance: in the RPHI FIR, flight-traffic corroborated 0% of events while NOTAM corroborated 70%. That inversion indicates a category where the formal notice channel, not observed traffic, was the reliable signal — a reminder that no single source is sufficient across all disruption types.
Regulatory Context
The categories above map onto established international frameworks that govern how airspace is restricted and how those restrictions are communicated.
- ICAO Annex 11 (Air Traffic Services) and ICAO Doc 4444 (PANS-ATM) define FIR responsibility and the provision of air traffic services within each region.
- ICAO Annex 15 (Aeronautical Information Services) governs the NOTAM and AIP system through which states publish airspace restrictions. The corroboration gap described above is a practical consequence of how — and how promptly — Annex 15 instruments are issued in fast-moving situations.
- EASA Conflict Zone Information Bulletins (CZIB), issued under the EU 965/2012 (Air Operations) framework, provide advisory guidance for operators. A CZIB is "advisory only" unless the relevant state civil aviation authority has issued a supporting NOTAM or AIP entry that closes or restricts the airspace.
- 14 CFR Part 91 (General Operating and Flight Rules) and the FAA Aeronautical Information Manual set the equivalent operating rules and information framework for US-registered operators, with FAA Advisory Circular 91-70B addressing oceanic and international operations.
Reference texts are published by ICAO and by EASA, and operators should treat the issuing authority's current instrument as definitive.
Key Takeaway
In 2026 to date, conflict-zone restrictions have been the dominant driver of lost airspace at 58% of airspace-days, followed by volcanic ash (21%) and seismic activity (11%), with the peak concentrated in May and June and most events resolving within days. The operational lesson is the detection gap: relying on published notices alone would have missed roughly three-quarters of confirmed disruptions in the most-affected FIRs. Multi-signal corroboration — combining official advisories with observed traffic behaviour — is what closes that gap.
Methodology and Provenance
All figures are sourced from FlySafe airspace-risk collectors for the window 1 January to 5 July 2026, as of 5 July 2026. An event is counted as confirmed only when at least two independent signals agree and a cause can be attributed; undetermined-cause detections are excluded. Inputs comprise public NOTAM, EASA, and FAA TFR advisories, volcanic-ash and seismic advisories, and FlySafe's ADS-B flight-traffic collection, which serves as the primary corroborating signal. Cause categories are strictly operational classifications. Where the dataset does not cover a dimension — such as specific NOTAM identifiers, per-carrier route changes, or the direct financial cost of rerouting — that information is not available in this analysis and has not been estimated.
Disclaimer: FlySafe Research is an aviation risk-intelligence service and is not an operational or regulatory authority. Analysis is based on publicly available data only. Nothing here replaces official NOTAMs, AIP entries, CZIBs, or guidance from the relevant state civil aviation authority, which remain the definitive sources for flight-planning decisions. For continuously updated, multi-signal airspace monitoring across the world's FIRs, FlySafe consolidates official advisories and live traffic data into a single confirmed-event view.
- Conflict-zone restrictions account for 58% of all airspace-days lost in 2026 (594 of 1,028), making geopolitical risk — not weather or regulation — the dominant operational planning factor for route planners.
- Volcanic ash is not an advisory but a hard constraint: engine-ingestion risk forces outright avoidance of affected volumes, meaning its 21% share of airspace-days has a disproportionate operational weight compared to softer restriction categories.
- Disruption is extremely concentrated geographically: Tehran FIR alone absorbed 249 airspace-days — roughly 24% of the entire 2026 total — while just four FIRs (Tehran, Damascus, RPHI, Tel Aviv) together account for the majority of recorded losses.
Powered by B1KEY
Live tools behind the analysis.
The signals FlySafe writes about are also published live — continuously verified by the Sentinel pipeline.
Information is accurate as of the publication date. FlySafe uses exclusively publicly available data.