Kansas City (MCI) Observed Traffic −60% on 17 November 2026 — a Reading From a Short Day in Our Feed; a Second Network Counts an Ordinary Tuesday
- Our count at Kansas City fell to 83 movements on Tuesday 17 November, against a 7-day average of 209 — on a day when our worldwide feed was also short, mostly before 12:00 UTC.
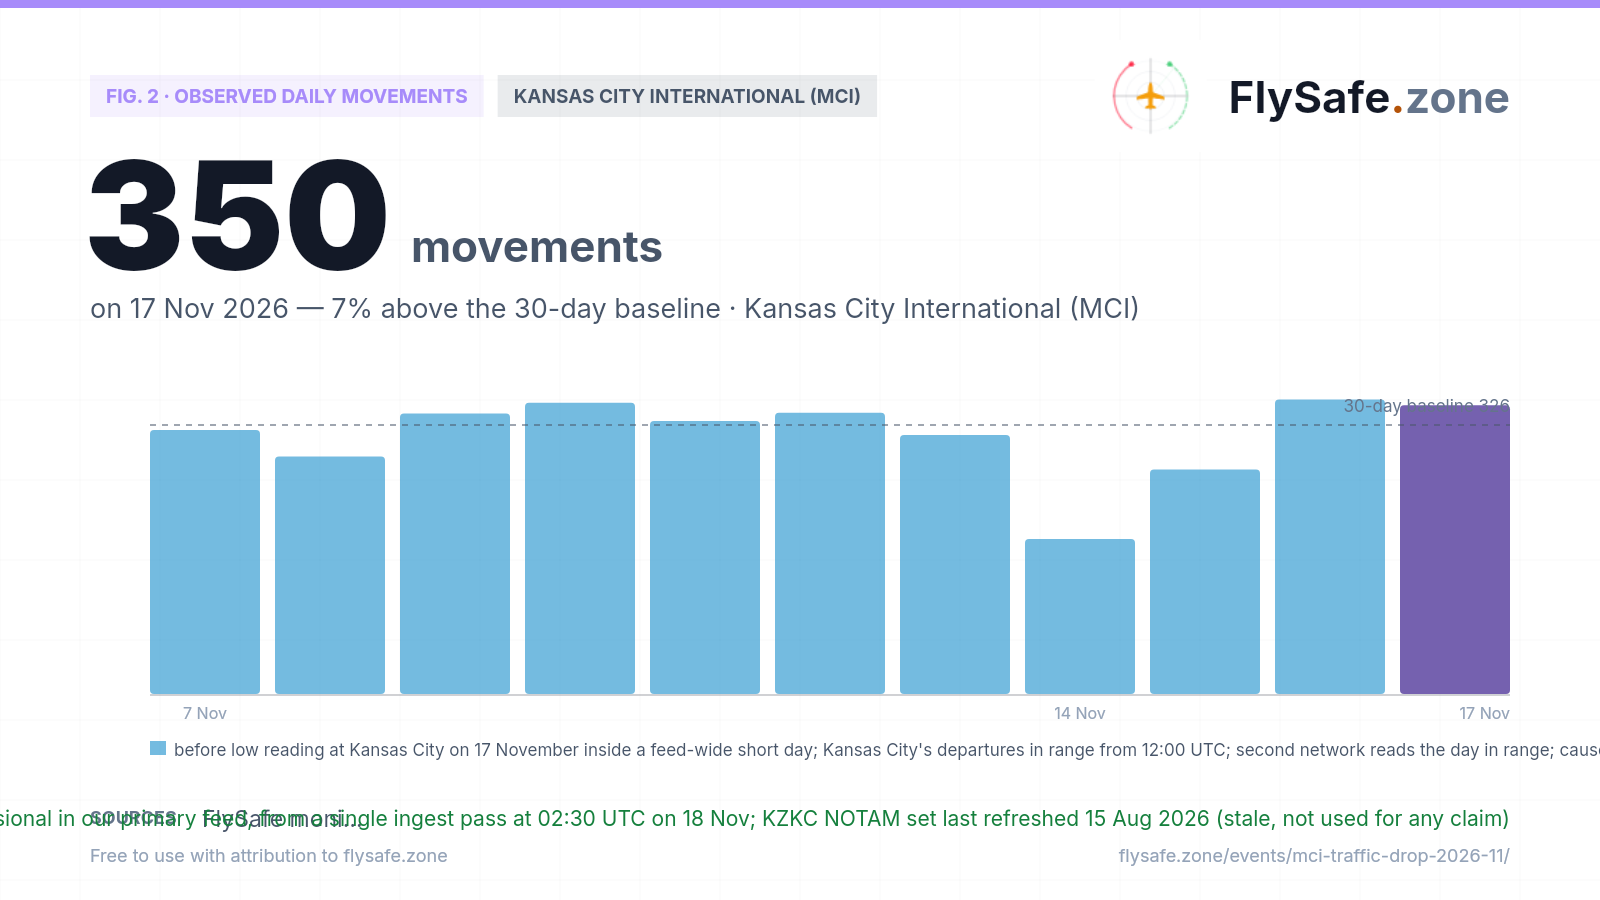
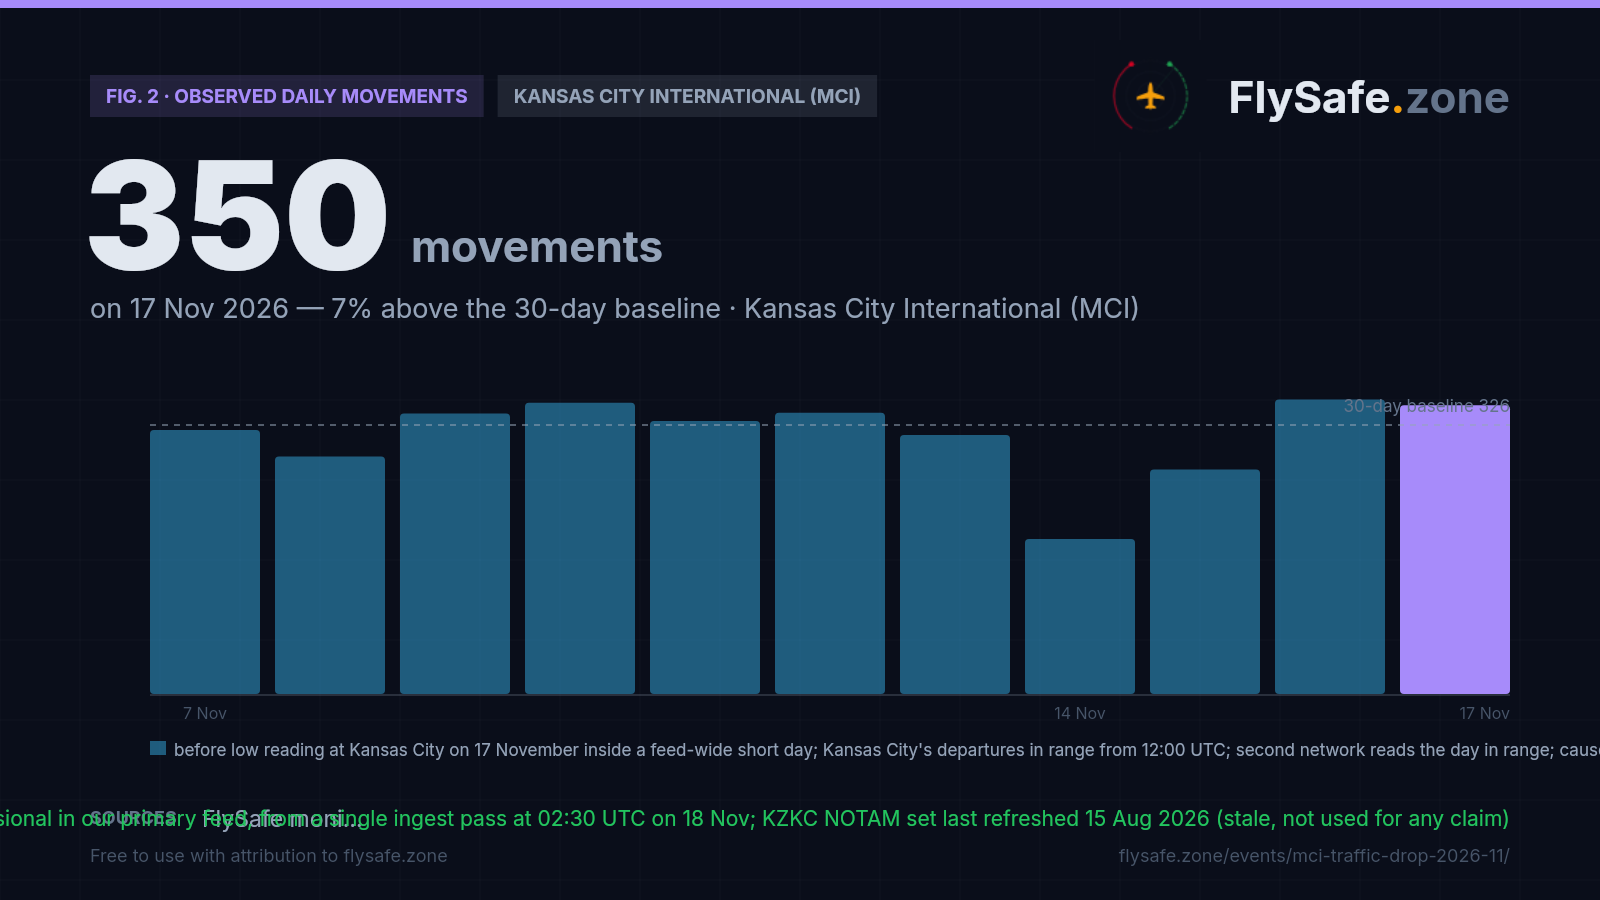
- A second ADS-B network we cross-check against counts 350 movements at Kansas City that day, above its usual 326. The weather was visual all day.
- 17 November is provisional in our own feed and can still rise on the next nightly refetch. Check your airline and the airport for the status of any flight.
Advisory timeline — how active is this episode
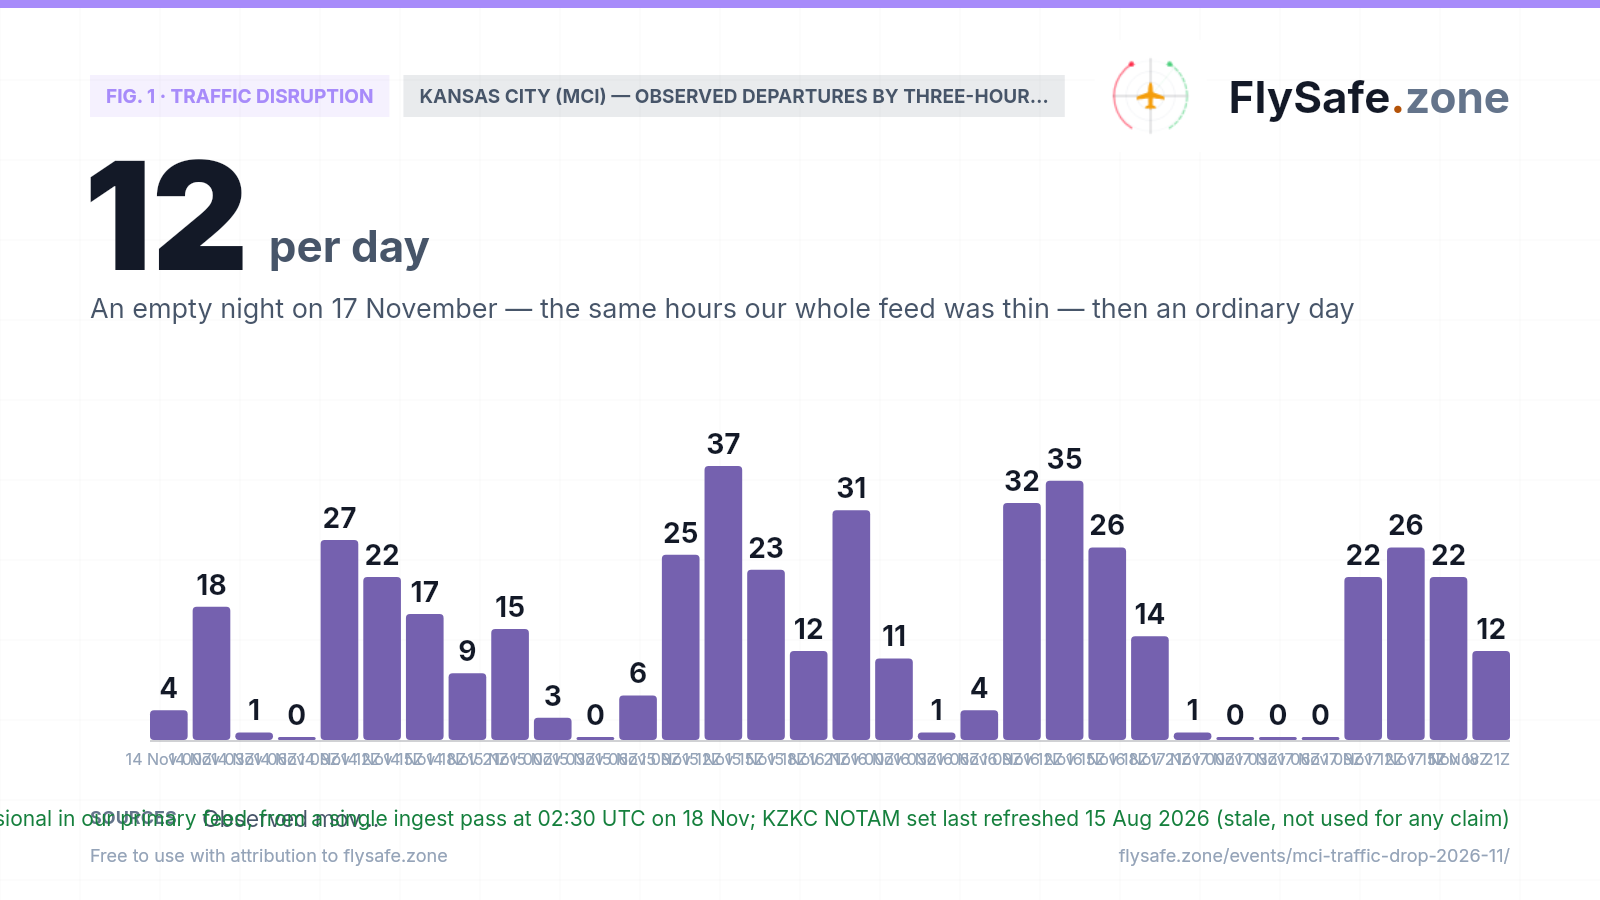
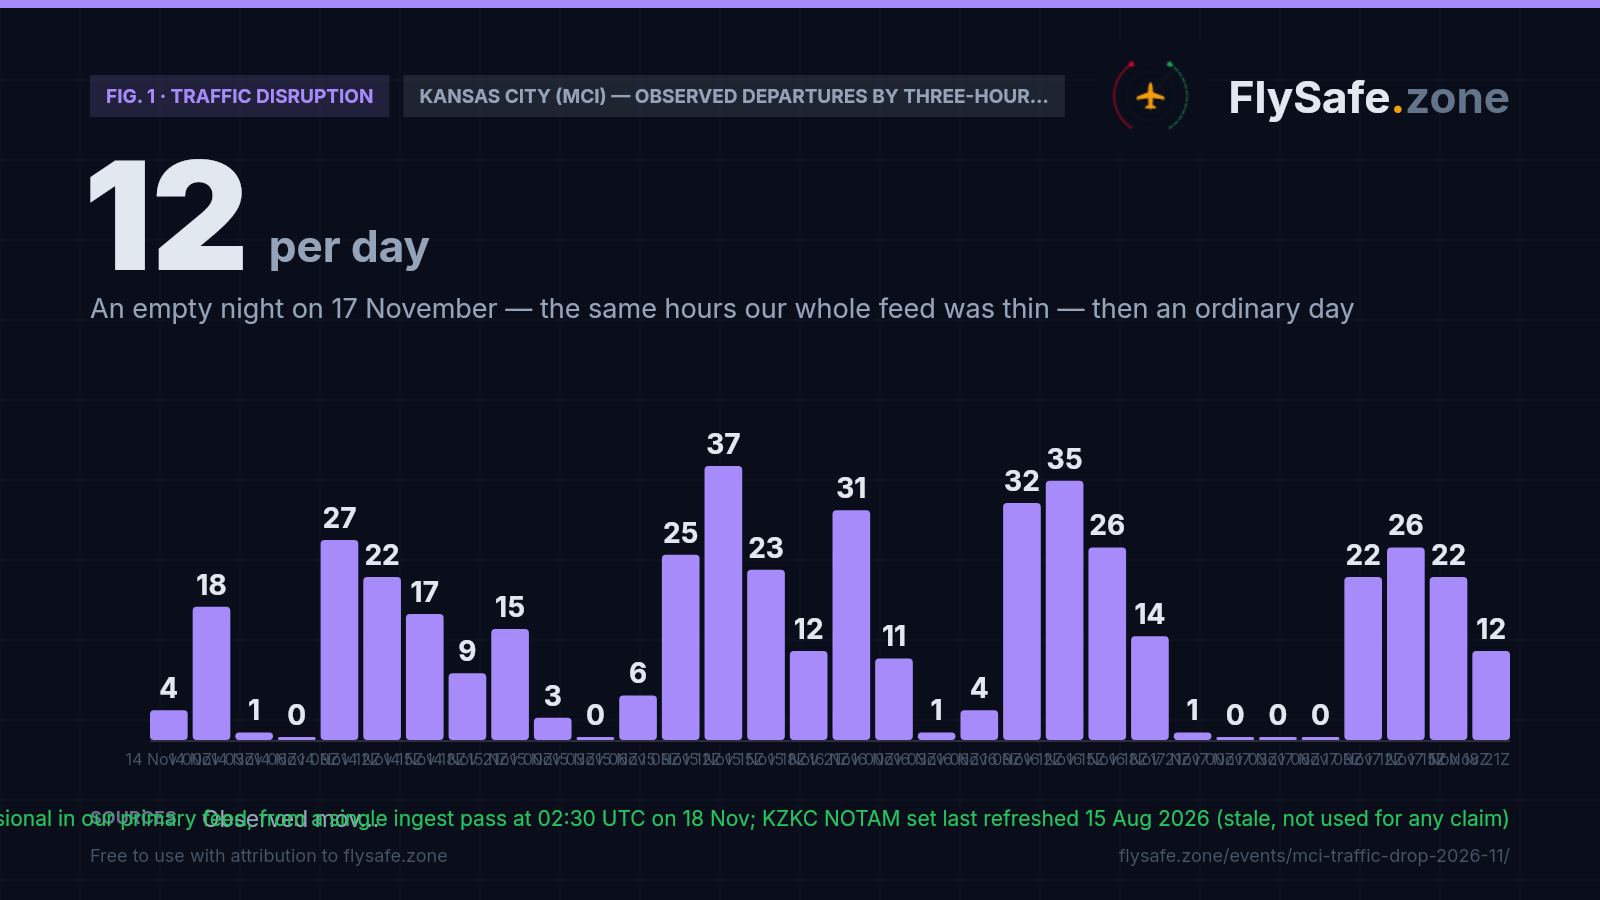
Our primary count at Kansas City is departures first: on every day from 10 October to 9 November it attached 0–7 arrivals a day to KMCI, from 10 to 16 November 49–135, and on 17 November none. Departures on 14–16 November read 98, 121 and 154. On Tuesday 17 November the four blocks from 00:00 to 12:00 UTC — Monday evening to Tuesday 06:00 in Kansas City — held 1 departure, against 23–47 in the same hours of the three days before; those are the hours in which our worldwide feed held about a sixth of its usual records. From 12:00 UTC the blocks read 22, 26, 22 and 12 — 82 departures, inside the 75–107 of 14–16 November. Three-hour blocks, 14–17 November:
Fig. 1 — Observed departures from Kansas City (MCI) in each three-hour UTC block, 14–17 November 2026 (Kansas City time = UTC−6); recounted from the underlying flight records in our primary feed; 16–17 November provisional · Data as of 18 Nov 2026, 12:58 UTC · pulse = second crowdsourced ADS-B network, in through 17 Nov (no 6 Nov row, so the window starts 7 Nov); primary-feed MCI departures by three-hour block 14–17 Nov recounted from the underlying flight records; 17 Nov provisional in our primary feed, from a single ingest pass at 02:30 UTC on 18 Nov; KZKC NOTAM set last refreshed 15 Aug 2026 (stale, not used for any claim) · Source: Observed movement records for KMCI from a crowdsourced ADS-B receiver network, as collected by FlySafe monitoring.
Airports in the exposure zone
| Airport | Size | Observed signal | FIR |
|---|---|---|---|
| Kansas City International Airport (MCI) | large | — · 17 Nov: 83 observed movements (83 dep / 0 arr), provisional, −60% vs a 209 7-day average; departures before 12:00 UTC 1 vs 23–47, from 12:00 UTC 82 vs 75–107; second network 350 (177 / 173) vs a 326 median; weather visual; no closure event in KZKC | KZKC |
| St. Louis Lambert International Airport (STL) | large | 380 km · Same FIR, same shape: 263 on 17 Nov (138 dep / 125 arr) vs 434 on 16 Nov; departures before 12:00 UTC 4 vs 28–65, from 15:00 UTC 96 vs 64–99; second network 469 vs 498 on 16 Nov | KZKC |
| Eppley Airfield (OMA) | medium | 244 km · Kansas City's first listed alternate: 170 on 17 Nov (86 dep / 84 arr) vs 199 on 16 Nov; second network 249 vs 219 on 16 Nov | KZMP |
| Denver International Airport (DEN) | large | 855 km · Same shape, other FIR: 1,063 on 17 Nov vs 1,687 on 16 Nov; departures before 12:00 UTC 38 vs 183–368, from 15:00 UTC 428 vs 358–514; second network 1,910 vs 1,975 on 16 Nov | KZDV |
| Chicago O'Hare International Airport (ORD) | large | 647 km · Same shape, other FIR: 1,466 on 17 Nov vs 2,319 on 16 Nov; departures before 12:00 UTC 25 vs 157–425, from 15:00 UTC 555 vs 425–567 | KZAU |
Distance alone does not determine impact — wind direction and the flight levels the ash reaches decide which airports and routes are affected on a given day. FIR = Flight Information Region.
What the second network shows: an ordinary Tuesday at Kansas City
FlySafe tracks observed departures and arrivals at 493 airports from crowdsourced ADS-B receiver data. Observed counts are a floor, not a total — receiver coverage varies — but an airport measured against its own baseline is a reliable shape. Kansas City International's last 30 days:
Fig. 2 — Observed daily movements at MCI, 7 Nov – 17 Nov (latest complete UTC day). Data as of 18 Nov 2026, 12:58 UTC · pulse = second crowdsourced ADS-B network, in through 17 Nov (no 6 Nov row, so the window starts 7 Nov); primary-feed MCI departures by three-hour block 14–17 Nov recounted from the underlying flight records; 17 Nov provisional in our primary feed, from a single ingest pass at 02:30 UTC on 18 Nov; KZKC NOTAM set last refreshed 15 Aug 2026 (stale, not used for any claim) · Source: FlySafe monitoring (ADS-B receiver network).
- The chart above is the second crowdsourced ADS-B network we cross-check against, not our primary feed. We plot it here because our own Kansas City series attaches almost no arrivals to the airport for most of the past six weeks (0–7 a day from 10 October to 9 November), so its day totals are mostly departures and do not compare day to day. The window starts on 7 November because the second network has no row for 6 November.
- Second-network baseline: 326 movements/day (median of 7–16 November), range 188–357. Tue 17 Nov: 350 — 177 departures, 173 arrivals — 7% above the median. The previous Tuesday, 10 November, read 353.
- Our primary feed on 17 Nov: 83 movements, all departures; the detection layer fired at −60% against a 7-day average of 209. Provisional: the day's records arrived in a single ingest pass at 02:30 UTC on 18 November and can still rise.
- Sat 14 Nov reads low in both networks — 188 here, 156 in our primary feed — and so do Denver (1,003 in the second network against 1,690–1,975 on 10–13 and 15–16 November) and St. Louis (246 against 378–498). A regional low in both collections at once is not explained here; it is outside this page's key day.
- Sun 15 Nov in our primary feed: 191 on recount from the underlying flight records (the stored row, cut short by a routine partial refresh, holds 143).
Observed counts are a floor, not a total. Live view: MCI airport brief.
What it means for flights
A crowdsourced count can fall without any traffic falling. Observed movements are reconstructed from ADS-B receivers run by volunteers, then aggregated on our side and loaded in nightly batches. When a batch arrives short, every airport in it reads low at once, while flights keep operating. That is why we publish observed counts as a floor, not a total, and why a −60% reading opens an investigation rather than a headline. A real local disruption — a restriction, a runway or system problem — would also lower the count, so we test for both rather than pick one.
The worldwide test: the whole feed was short on 17 November. Our worldwide table holds 81,931 flight records for 17 November against 121,560–141,851 for each of 13–16 November, and it arrived in a single pass at 02:30 UTC on 18 November. The shortfall sits in the first half of the UTC day: 8,024 records with a take-off between 00:00 and 12:00 UTC against 46,217 the day before, while 15:00–22:00 UTC holds 56,154 against 50,244. The large US hubs show it plainly — Chicago O'Hare logged 25 departures before 12:00 UTC against 157–425 on 14–16 November and 555 from 15:00 UTC against 425–567; Denver 38 against 183–368, then 428 against 358–514. A reading that moves with the entire feed is first of all a feed reading.
The Kansas City test: ordinary once the feed recovered, and ordinary in a second network. If something at Kansas City itself had cut traffic, the daytime hours would show it too. They do not: from 12:00 UTC (06:00 Kansas City time) our feed attached 82 departures to MCI, against 75, 97 and 107 in the same hours of 14, 15 and 16 November. The second crowdsourced ADS-B network we cross-check against counts 350 movements at Kansas City on 17 November — 177 departures and 173 arrivals — against a 326/day median for 7–16 November and 353 on the previous Tuesday. The zero arrivals in our own count say little on their own: for most of October and early November our feed attached fewer than 10 arrivals a day to Kansas City.
Weather, notices and closure signals. Kansas City's routine weather reports for 17 November in our set were all visual: visibility 9–10 statute miles, sky clear or with high cloud at 25,000 ft, a southerly wind of 5–15 kt that gusted to 21–25 kt between about 17:00 and 20:00 UTC, with a peak gust of 26 kt reported at 18:20 UTC. Our NOTAM set for the Kansas City FIR (KZKC) was last refreshed on 15 August 2026 and holds none for MCI, so we make no claim either way about current notices. Our detection layer registered no closure event in KZKC on 16–17 November — the last one in our records dates from May 2026 — and no FIR-level traffic anomaly in KZKC after 15 November. These are FIR-level observations, not statements about the airport.
What would close this episode — and what would reopen it. Two things would close this episode in our data: our 17 November total rising on the next nightly refetch, as provisional days usually do once the missing records arrive, and the second network's 350 holding as published. If our refetched count still reads low and the second network revises down, we will say so here. This automated multi-signal analysis surfaces anomalies like this one early and publishes what can and cannot be measured; the operating picture on any given day belongs to the airport, the airlines and the relevant authorities.
Passenger questions, answered from the data
Our data does not show that. Our own observed count at Kansas City fell to 83 movements on 17 November against a 7-day average of 209, but our whole worldwide feed was short that day — 81,931 flight records against 121,560–141,851 on 13–16 November — and Denver, Chicago O'Hare and St. Louis read low by the same pattern. A second crowdsourced ADS-B network counts 350 movements at Kansas City that day, above its 326/day median. For a specific flight, check the airline and the MCI brief, which updates nightly.
The headline is what our own detection layer read: 83 movements in our primary feed. The daily chart is a second crowdsourced ADS-B network, plotted because our primary Kansas City series attached almost no arrivals to the airport on most days from 10 October to 9 November, so its day totals do not compare cleanly. Both are observed counts — a floor, not a total.
Not according to the airport's routine weather reports in our set: on 17 November every report was visual, with visibility of 9–10 statute miles and high cloud at most. The afternoon wind was southerly and gusty — 21–25 kt between about 17:00 and 20:00 UTC, peak 26 kt. Over the past 30 days 4% of Kansas City's reports in our set were in instrument conditions; none fell on 17 November.
We do not make that call — we publish what our monitoring can and cannot measure. Here the reading coincides with a short day in our own feed, and a second network reads the day in its usual range, so it is not by itself evidence of a disruption. Your airline and the airport are the authoritative sources for any flight.
For media — the full kit
Everything on this page — charts, CSV, quotes — is published under CC BY 4.0: free to reuse with attribution to FlySafe.zone. Charts come in dark (social/web) and light (print/light layouts) versions; attribution and license are embedded in every file.
“Observed traffic at Kansas City International fell to 83 movements on 17 November 2026 in FlySafe's own crowdsourced ADS-B feed — 60% below its 7-day average of 209 — on a day when the whole worldwide feed held 81,931 flight records against 121,560–141,851 on the four days before; a second crowdsourced ADS-B network counts 350 movements at Kansas City that day, above its 326-a-day median, and the low reading has no confirmed local cause, according to flight-monitoring service FlySafe.zone.”
Boilerplate — about the source (for your article footer)
FlySafe.zone monitors airspace risk and observed airport activity worldwide: 334 flight-information regions scored daily, GPS-interference signals, volcanic-ash exposure and daily observed movements at 493 airports from the crowdsourced ADS-B receiver network. Methodology: flysafe.zone/methodology.
Need a different cut of the data, a comment, or numbers for another airport? Leave an email — we answer fast during active events.